1.7. Troubleshooting
We have spent thousands of hours with the Kafka stack. For every Fast Data release we test both our code and Kafka itself in order to weed out any bugs. Below are some of the most common issues we encountered.
Contents
- Troubleshooting
- Service Starts but Doesn’t Work
- Kafka REST Avro Support
- Schema Registry Starts but Fails Later
- A Schema Registry Instance Fails to Start
- Connect Don’t Start
- Logs Error: No such file or directory
- Service starts but exits without errors in logs
- HDFS Connector does not work
- Underreplicated partitions with Cached zkVersion not equal to that in zookeeper error
- Kafka REST does not return messages
- Brokers fail to start with Zookeeper Authentication
- Brokers fail to start
- Generic Debug Information
1.7.1. Service Starts but Doesn’t Work
In such cases the best bet is to check the service’s role log from Cloudera Manager. In our experience there are cases where a service process may start but stack in the initialization process. Logs will usually show the reason.
An example are Kafka Brokers, where if they start with too little RAM available, they won’t be able to start their listeners.
Unfortunately given the facilities provided by Kafka and Cloudera Manager, it is very difficult for us to catch such errors for the time being.
Starting with CDH 5.8, Cloudera Manager can detect some errors in JVM based applications. We do make use of this feature but your mileage may vary.
1.7.2. Kafka REST Avro Support
For Kafka REST Proxy to support Avro, access to a running Schema Registry is needed.
1.7.3. Schema Registry Starts but Fails Later
Schema Registry uses a Kafka producer to store information to its topics. In some rare occasions we’ve seen this producer to fail to start due to memory issues. Increasing the memory limit for Schema Registry doesn’t seem to help.
There seems to be some connection to the number of bootstrap servers (listeners) and this issue, so you could try to lower the number of your listeners if you can —e.g if you have many listeners for each broker.
1.7.4. A Schema Registry Instance Fails to Start
An instance of Schema Registry at version 3.2.2 or greater may fail to start when there is already a master instance running, or all instances try to start together. Usually it is enough to restart the failed instance and completely safe.
A possible permanent fix for this, is to increase the kafkastore.timeout.ms
for the Schema Registry role. The default is 500 milliseconds. An increase to
1000 or even 1500 milliseconds can help.
At version 4.0.x, a Schema Registry will also fail to start if you disable the http listener.
1.7.5. Connect Don’t Start
The are usually two scenarios that lead to this issue.
The first time a Connect role is started, the first worker to run creates the topics for Connect Distributed’s data with a replication factor of 3 as suggested by Confluent. If you have less brokers than 3 the topics will fail to be created. Adjust Connect’s topics replication factor and start again the Connect Distributed instances.
Should you ever need to increase the replication factor, either create a new cluster or perform the steps described in Kafka’s documentation.
The Connect topics may only be created once but Connect workers, everytime they are started, they check if they are able to read and write from/to the configuration topics. If the test fails, the connect worker will exit. In such a case please ensure that the brokers are in a good state. There are cases where the brokers maybe up but unable to work properly. The monitoring CSD can help identify such issues. For example if a broker is up but doesn’t work, its partitions will show as offline in Grafana.
1.7.6. Logs Error: No such file or directory
We have found that in some occasions Cloudera Manager doesn’t give proper ownership to the logging directory, thus the Kafka services can’t write to their logs.
The Fast Data services run under user fastdata and group fastdata. In
case you encounter this error, please make sure in the nodes that run Fast Data
services, the /var/log/fastdata directory belongs to this user and group. If
not, assign ownership manually:
chown fastdata:fastdata /var/log/fastdata
1.7.7. Service starts but exits without errors in logs
This could be due to the process being killed due to using too much memory (out
of memory error). Usually Cloudera Manager from 5.5 onwards will show you this
in the process status. Try to increase the heap size for the process. For Kafka
REST you may also try to decrease the consumer.request.max.bytes property.
Another scenario that can lead to such an issue, is when incompatible classes are loaded. This holds specially true for Kafka Connect. Adding a connector to the classpath that shadows libraries used by Kafka with its own versions may lead to connect worker crashing with no message whatsoever (even if log level is set to TRACE). This is the reason we compile the Stream Reactor collection of connectors with the exact same version of Kafka we provide in our KAFKA_CONFLUENT parcel
1.7.8. HDFS Connector does not work
Note
This issue happened with the 3.1.x version of the KAFKA_CONFLUENT parcel. Please contact us if you still see this issue with 3.2.x or later.
If you have installed and activated the FAST_DATA_STREAM_REACTOR parcel it can cause problems with the HDFS connector that comes with the FAST_DATA_KAFKA_CONFLUENT parcel due to the included HBase connector jars shadowing some hadoop java classes.
Please deactivate the FAST_DATA_STREAM_REACTOR. We will issue a proper solution in the future to let you disable only specific connectors.
1.7.9. Underreplicated partitions with Cached zkVersion not equal to that in zookeeper error
In some cases you may notice underreplicated partitions and brokers out of sync whilst your cluster is all green with a log message like:
INFO Partition [topic,n] on broker m: Cached zkVersion [xxx] not equal to that in zookeeper, skip updating ISR (kafka.cluster.Partition)
This is a documented issue. It may be fixed with a rolling restart of the brokers. If your Cloudera license does not permit automatic rolling restart, just restart the brokers one by one by hand.
To prevent the issue from reoccuring you can try to increase zookeeper session
timeout for the brokers, via the setting zookeeper.session.timeout.ms in
Fast Data’s configuration page. Since this change will require a restart of the
brokers, you can adjust it before performing the rolling restart that will fix
the issue.
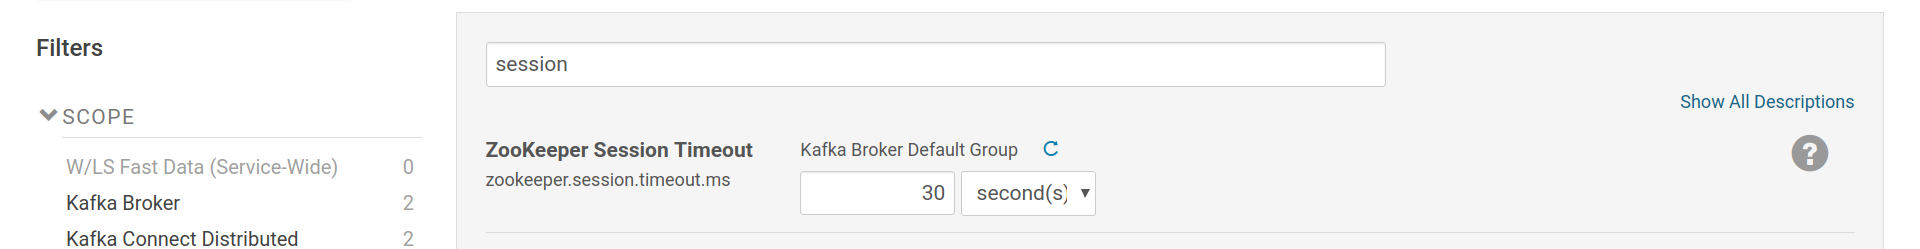
Increase ZooKeeper Session Timeout for the Brokers to possibly avoid this in the future.
1.7.10. Kafka REST does not return messages
The consumer.request.timeout.ms option is by default set at 1000. Frequently
this leads to Kafka REST not returning any messages for topics with more than a
couple thousand messages, especially if the offset reset of the consumer is set
at earliest.
To fix this, consumer.request.timeout.ms should be set to 30000. Due to
a bug since version 3.2.x of Kafka REST, setting it lower isn’t possible because
this settings leaks to Kafka REST consumer’s request.timeout.ms option which
can’t be lower than a certain threshold (depends on other configuration values).
1.7.11. Brokers fail to start with Zookeeper Authentication
Since version 3.2.x Kafka brokers may fail to start if Zookeeper Authentication
(authenticate.zookeeper.connection) is enabled and not at least one broker
is already up. This is due to the brokers not being able to get controller
status whilst starting up when Zookeeper authentication is enabled.
The first thing to try, is a controller election. At the Fast Data service in Cloudera Manager, visit the instances tab. Select one broker (any will do, just one) and then use the action trigger controller election.
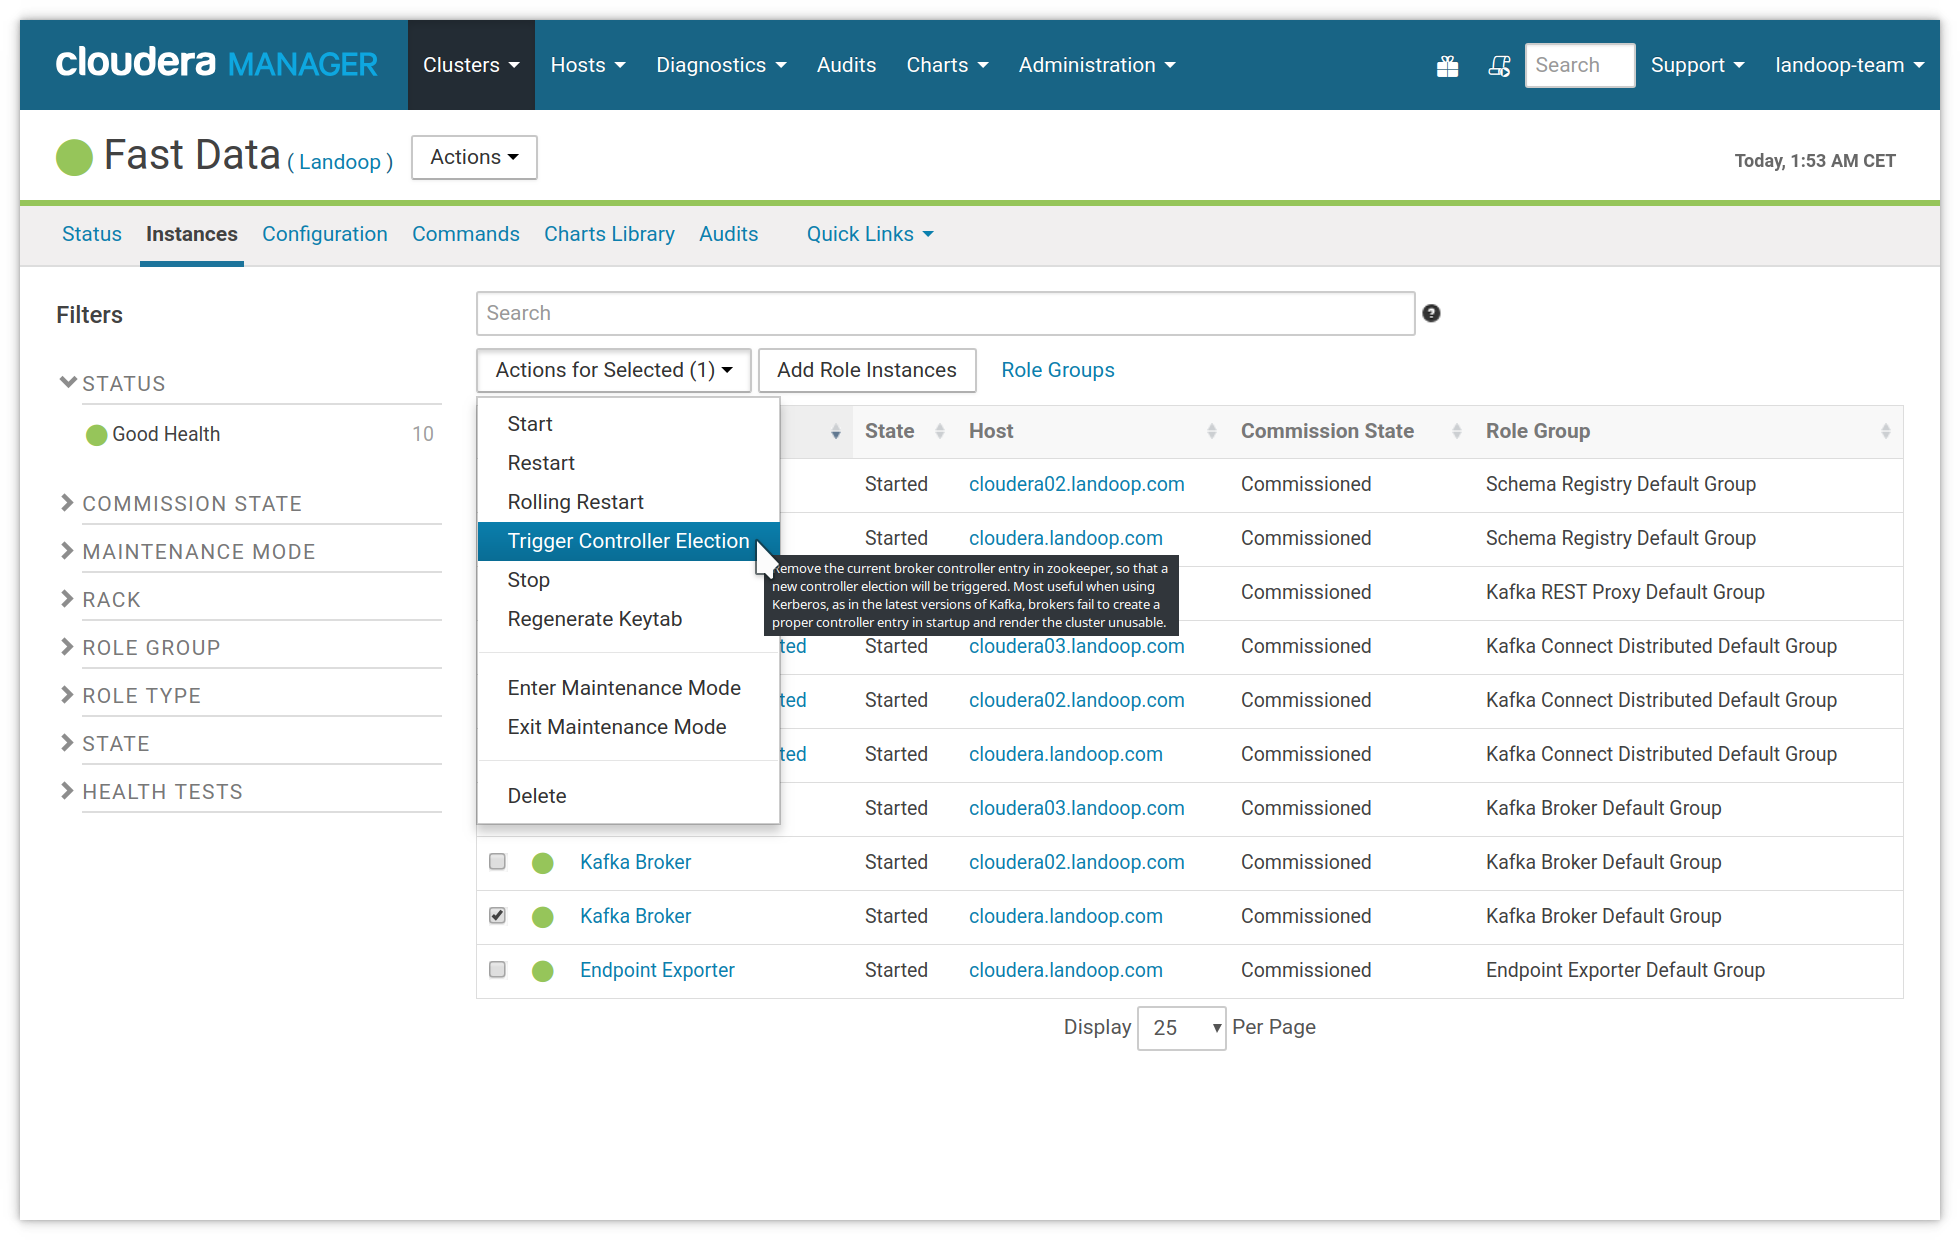
Manually trigger a controller election by selecting one broker and running the action with the same name.
If this doesn’t solve the problem or all brokers are down, please disable temporarily Zookeeper authentication, start one broker, enable Zookeeper authentication, start the rest of the brokers and restart the first one.
To avoid this problem in the future, on a Kafka cluster setup with Kerberos, please perform only rolling restarts on the brokers.
1.7.12. Brokers fail to start
Sometimes a null entry may be written in the zookeeper controller node by a broker. This behaviour prevents the cluster from working and also doesn’t let the controller election process to trigger.
The solution, as in the previous paragraph is to trigger manually a controller election. This action removes the null entry, so the election process can proceed.
At the Fast Data service in Cloudera Manager, visit the instances tab. Select one broker (any will do, just one) and then use the action trigger controller election.
Manually trigger a controller election by selecting one broker and running the action with the same name.
1.7.13. Generic Debug Information
A suggested debug process of a failing instance/role is:
- Check the stdout and stderr output for any messages. If the startup failed due to misconfiguration, the setup script may print a useful message in stdout.
- Check the role log for any messages that are at error level ERROR or FATAL. Also check the timestamp of the log messages because the role may didn’t write any messages and Cloudera Manager shows the messages from the previous instance start.
- Set the Logging Threshold to DEBUG or TRACE, start the instance again and check the log messages. Usually this method is used to find lower level issues such as networking problems.