1.2. Advanced Installation Topics
Here you can find information about installing multiple instances of Fast Data to the same cluster as well as how to uninstall and clean-up remaining files and zookeeper.
Contents
1.2.1. Multiple Service Instances
We took special care to enable you to run more than one Fast Data instances on your Cloudera cluster. Whilst it may seem counterintuitive at first there are legit reasons for such a setup. Examples would be security and resource separation. Whilst Kafka supports ACLs, for simple tasks such as separation between two teams, it may be much easier to setup and manage a second Kafka cluster. Resource separation could be using different nodes or different disks per cluster.
In order to add a second (or… nth) instance you have to be very careful of four configuration options, because they can damage your existing cluster if shared between different Kafka clusters. The last part (ports) won’t damage your cluster but will prevent the new instance from starting until corrected.
Kafka Brokers’ Znode. This indicates the znode under which the brokers will keep the cluster information and should be unique for each cluster. The default is
/fastdata.
Setting a different Znode during the Install Wizard.
Logs ID. A unique string that is appended to the logs filenames.

Setting a unique logs ID in the Install Wizard.
Kafka Brokers’ Data Directories (log.dirs), the directories where brokers store their data. Change it to something unique amongst the instances.

Setting a different data directory during the Install Wizard.
Schema Registry’s Znode. As with the Broker’s Znode, change it to something different from the default:
/schema_registry.
Setting a different Znode for the Schema Registry in the Install Wizard.
Ports; you have to set different ports for the new instances. In Cloudera Manager visit the Fast Data service page, go to configuration, select ports and change at least the ones you use (depends on roles used). Remember to adjust the JMX ports as well.
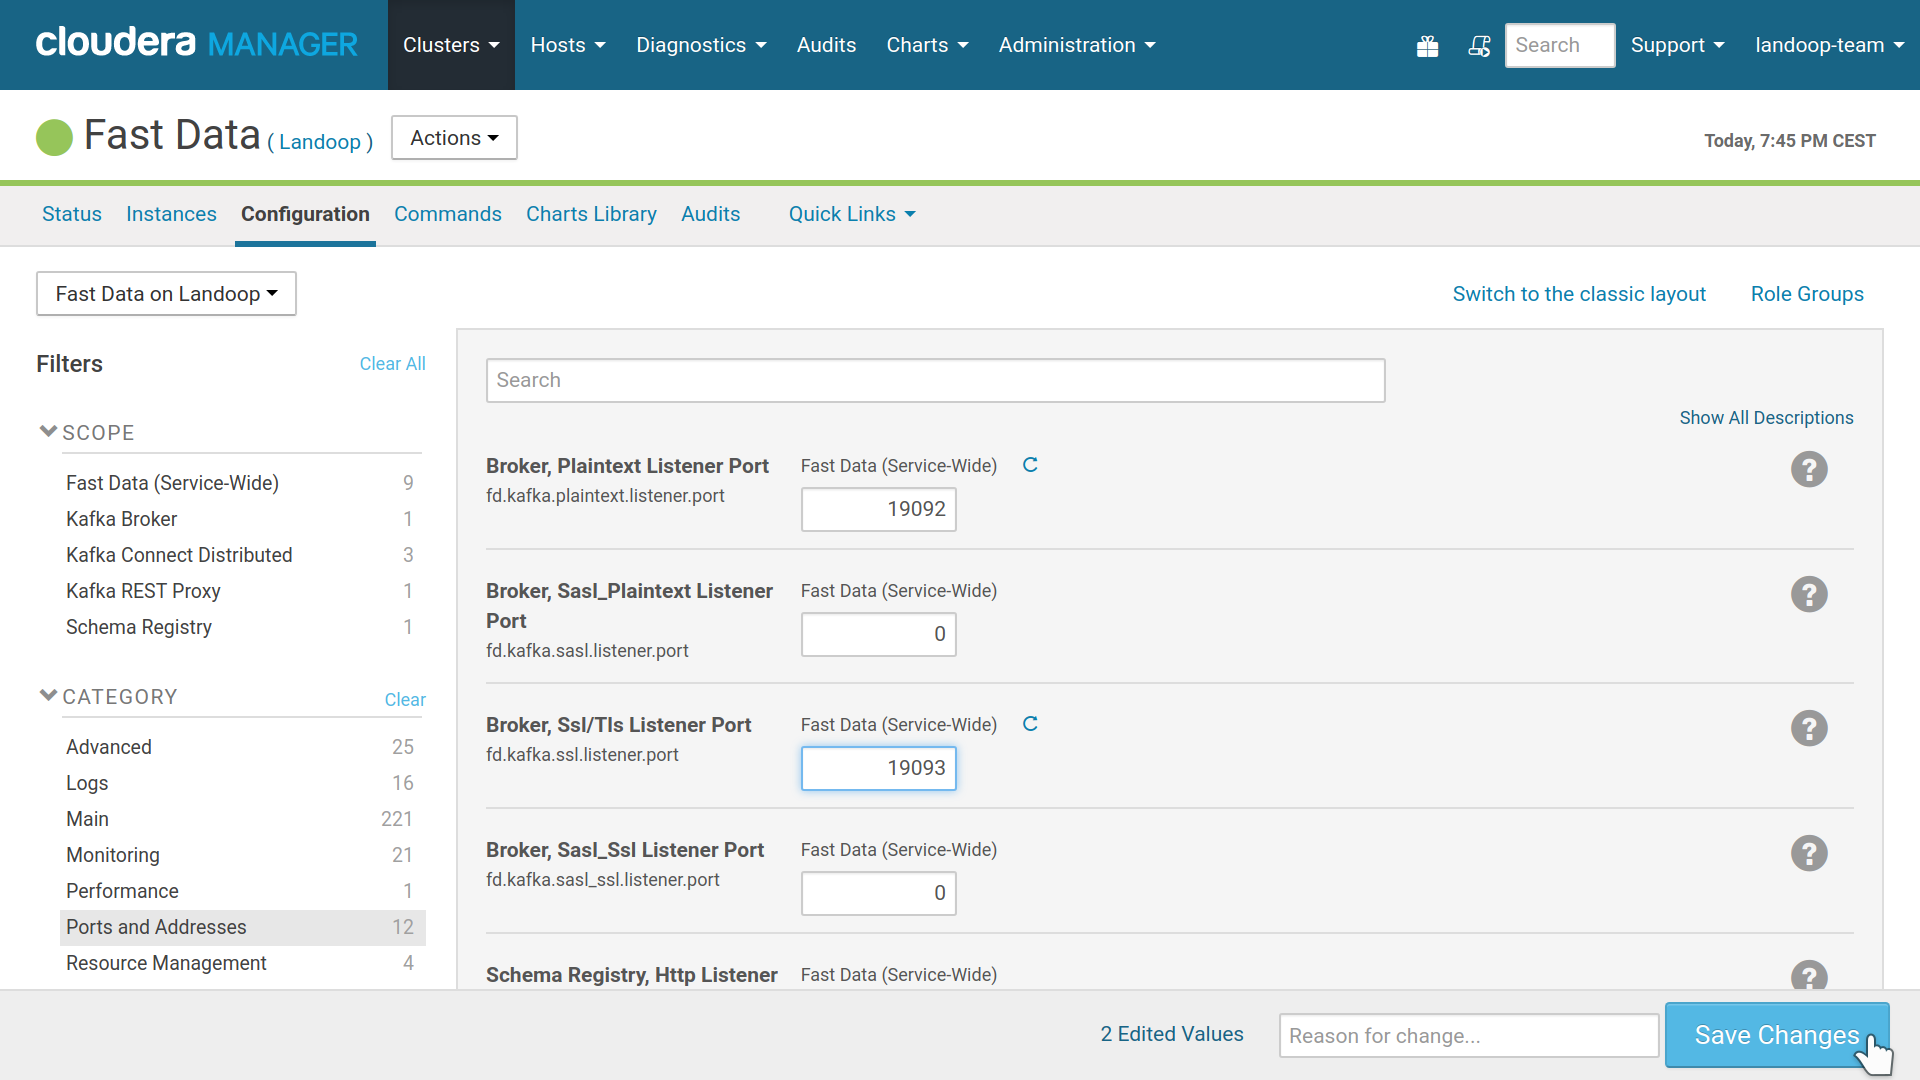
Adjusting ports for a 2nd Fast Data instance.
1.2.2. Manual parcel installation
If the Cloudera cluster doesn’t have internet access, an alternative installation method should be used. Such methods are better documented in Cloudera’s website.
For these methods, the cluster administrator to manually download our parcels and make them available to the cluster.
Our parcels can be found at our archive. The version downloaded and installed should match the version of the CSD. As an example, if the 3.3 CSD is used, the latest 3.3.x KAFKA_CONFLUENT parcel should be used. This holds true for our other CSDs (Tools and Monitoring) as well. Special care is needed for STREAM_REACTOR, where its version should match exactly KAFKA_CONFLUENT version (e.g for Kafka 3.3.0, a Stream Reactor build for 3.3.0 should be used).
1.2.3. Cleanup, Reinstall, Remove
Whether you want to remove completely Fast Data or re-install the service, some manual cleaning procedure may be needed. The CSD’s role instances store data onto the disk and/or Zookeeper. Unfortunately we cannot automate this for you.
If you only want to re-install the service, you must follow the Clean Zookeeper Znodes or adjust your Zookeeper Znodes with new names. Also it is advised to follow the Clean Data Directories paragraph to free space.
1.2.3.1. Uninstall
To uninstall the CSD, you should first stop any running Fast Data services and then delete them from the cluster.
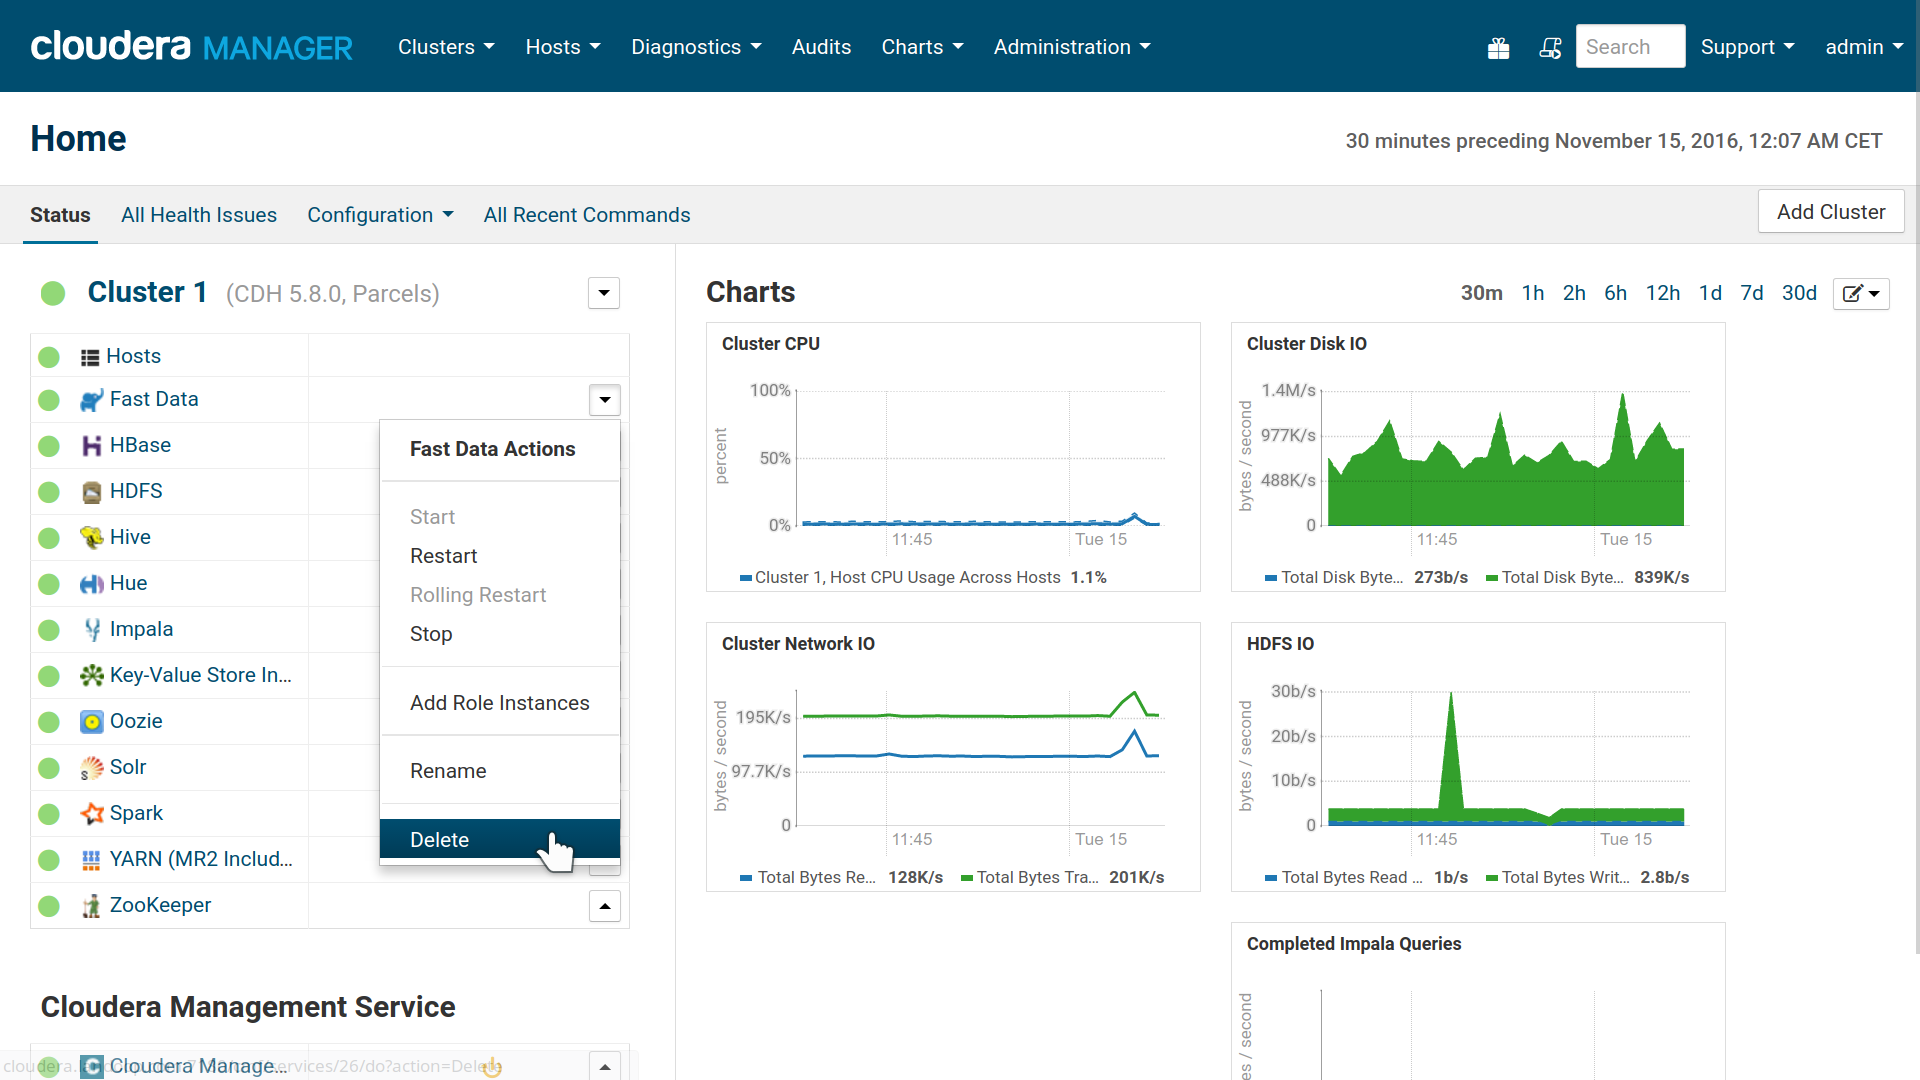
Remove Service
Next visit the CM’s Parcels tab and deactivate, remove from hosts and uninstall our parcel.
Next stop the Cloudera Manager service, delete the CSD file from your Cloudera
CSD directory (usually /opt/cloudera/csd/) and restart the Cloudera Manager
for the change to take effect.
In our experiments, in one occassion Cloudera Manager wasn’t able to start again after the CSD removal due to missing metric sources. The solution was to copy the CSD back, start CM with it, stop it and remove the CSD again.
1.2.3.2. Clean Data Directories
The only service that stores data are the Kafka Brokers. Each broker has a
unique ID and stores its data inside log.dirs.
If you remove a Fast Data service, you may want to clean these directories to
free up space and make sure any future installation won’t find old data. Default
log.dirs location is at /var/local/fastdata/data.
Logs are also stored for your roles. These are stored inside
/var/log/fastdata and may be removed freely.
1.2.3.3. Clean Zookeeper Znodes
Kafka Brokers and Schema Registry use Zookeeper to store data.
The default Znode for brokers is /fastdata and all topic data are stored
below this. To delete it you may use the Zookeeper client:
zookeeper-client -server zookeeper.server:2181 rmr /fastdata
For schema registry the default Znode is /schema_registry and you may delete
it by running:
zookeeper-client -server zookeeper.server:2181 rmr /schema_registry
1.2.3.4. Kerberos and Zookeeper ACLs
If you have enabled Kerberos authentication and the Zookeeper ACLs
(zookeeper.set.acl option) Kafka’s Znode is secured and only writeable by
the kafka Kerberos principal, hence you can’t delete it.
The easiest way to mitigate this, is to restart the brokers with the
zookeeper.set.acl disabled. The CSD will then unsecure the znode and you
will be able to delete it with zookeeper-client.
In case you don’t have anymore access to the service, you should use the
kafka kerberos principle with the zookeeper-client to be able to delete
it. Directions for this procedure are outside the purpose of this document.
1.2.4. Prometheus Monitoring
Note
This feature requires Fast Data Monitoring CSD 2.0 or greater.
Up until Fast Data 3.2.x and Fast Data Monitoring 1.x, monitoring was handled exclusively via the Fast Data Monitoring CSD and required setting manually metric exporter roles for each instance.
In an attempt to improve upon this and also offer process level metrics (memory usage, CPU, open file descriptors), current Fast Data offers the option to instrument its roles with metric exporters as java agents.
Our monitoring solution works by converting JMX metrics to Prometheus metrics
and exposing these as endpoints that Prometheus scrapes. The tool that takes
care of this task is called jmx_exporter and it can work in two modes: as
a standalone server that connect to the process to be monitored via the JMX port
or as a java agent, which is loaded into the process to be monitored (e.g in a
connect worker). The former case is handled, as always, by the Fast Data Monitoring
service. The latter is part of the Fast Data service.
The configuration option
fd.monitoring.prometheus enables augmenting with java agents the Kafka Connect,
Schema Registry and REST Proxy roles. The brokers require to enable the
fd.kafka.monitoring.prometheus.allow option as well. The reason behind this,
is that the brokers on a production cluster may export tens or even hundreds of
thousands of metrics. The jmx_exporter java agent isn’t well tested under such
load and can experience issues. As an application running as a java agent is essentially
a part of the application it runs in —the brokers in this case— it can cause
problems to it. If for example the jmx_exporter was to crash under the load, the broker
would crash as well. Thus for production systems with many thousands of partitions
and thousands of clients, it is advised to augment the brokers via the standalone
server: adding broker metrics exporters in Fast Data Monitoring instead of setting
fd.kafka.monitoring.prometheus.allow.
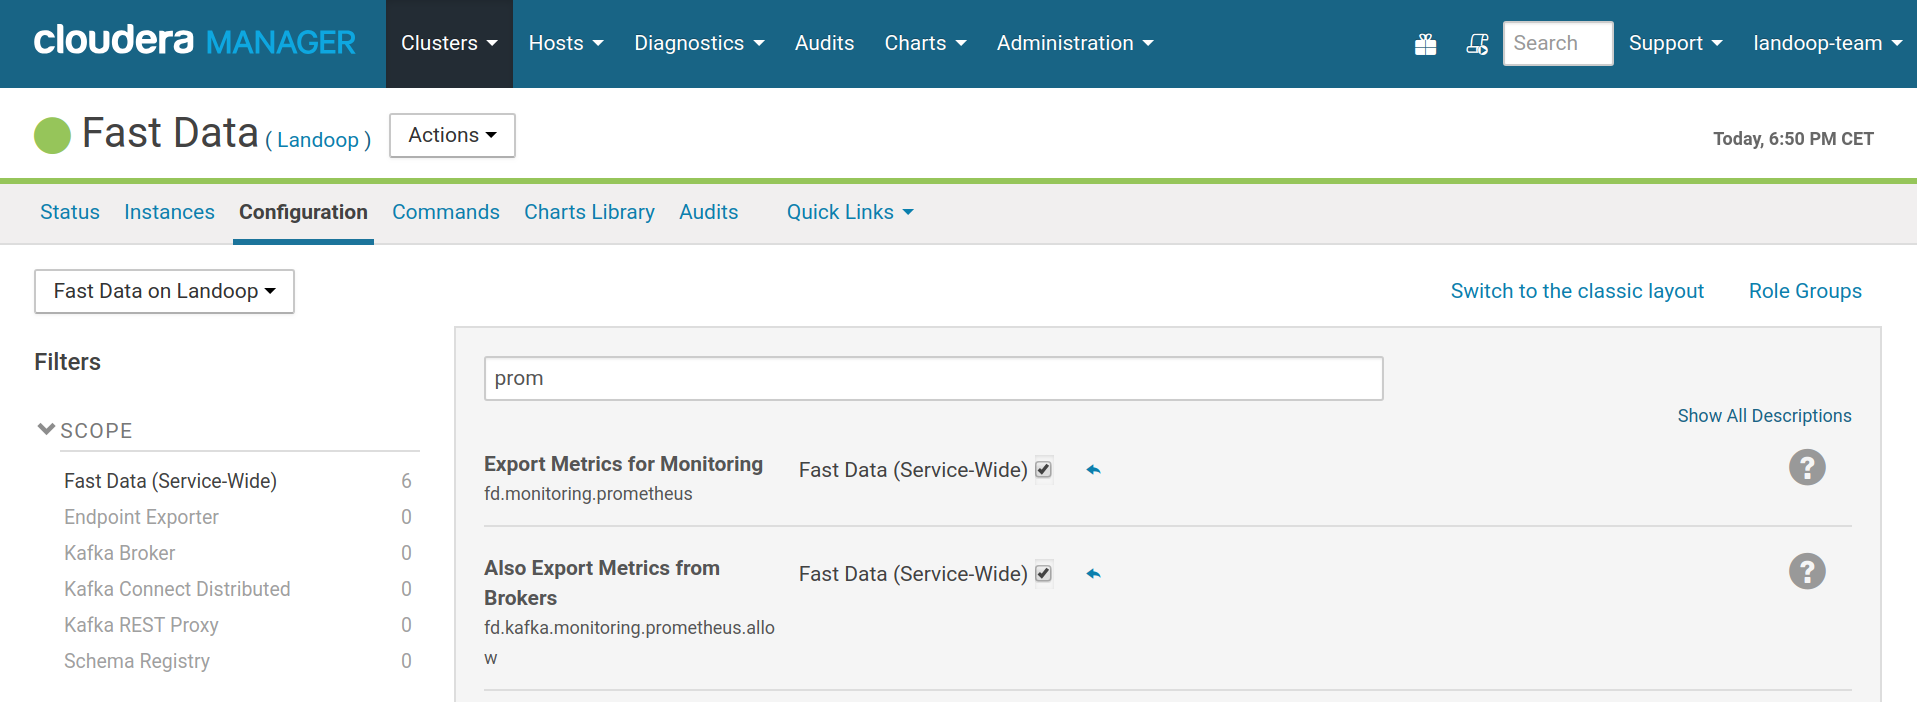
Enabling metrics exporting via java agents
If you have added an Endpoint Exporter instance to your Fast Data service, the endpoints will be exposed via zookeeper and Prometheus will autoconfigure itself, so you will not have to add addresses manually.
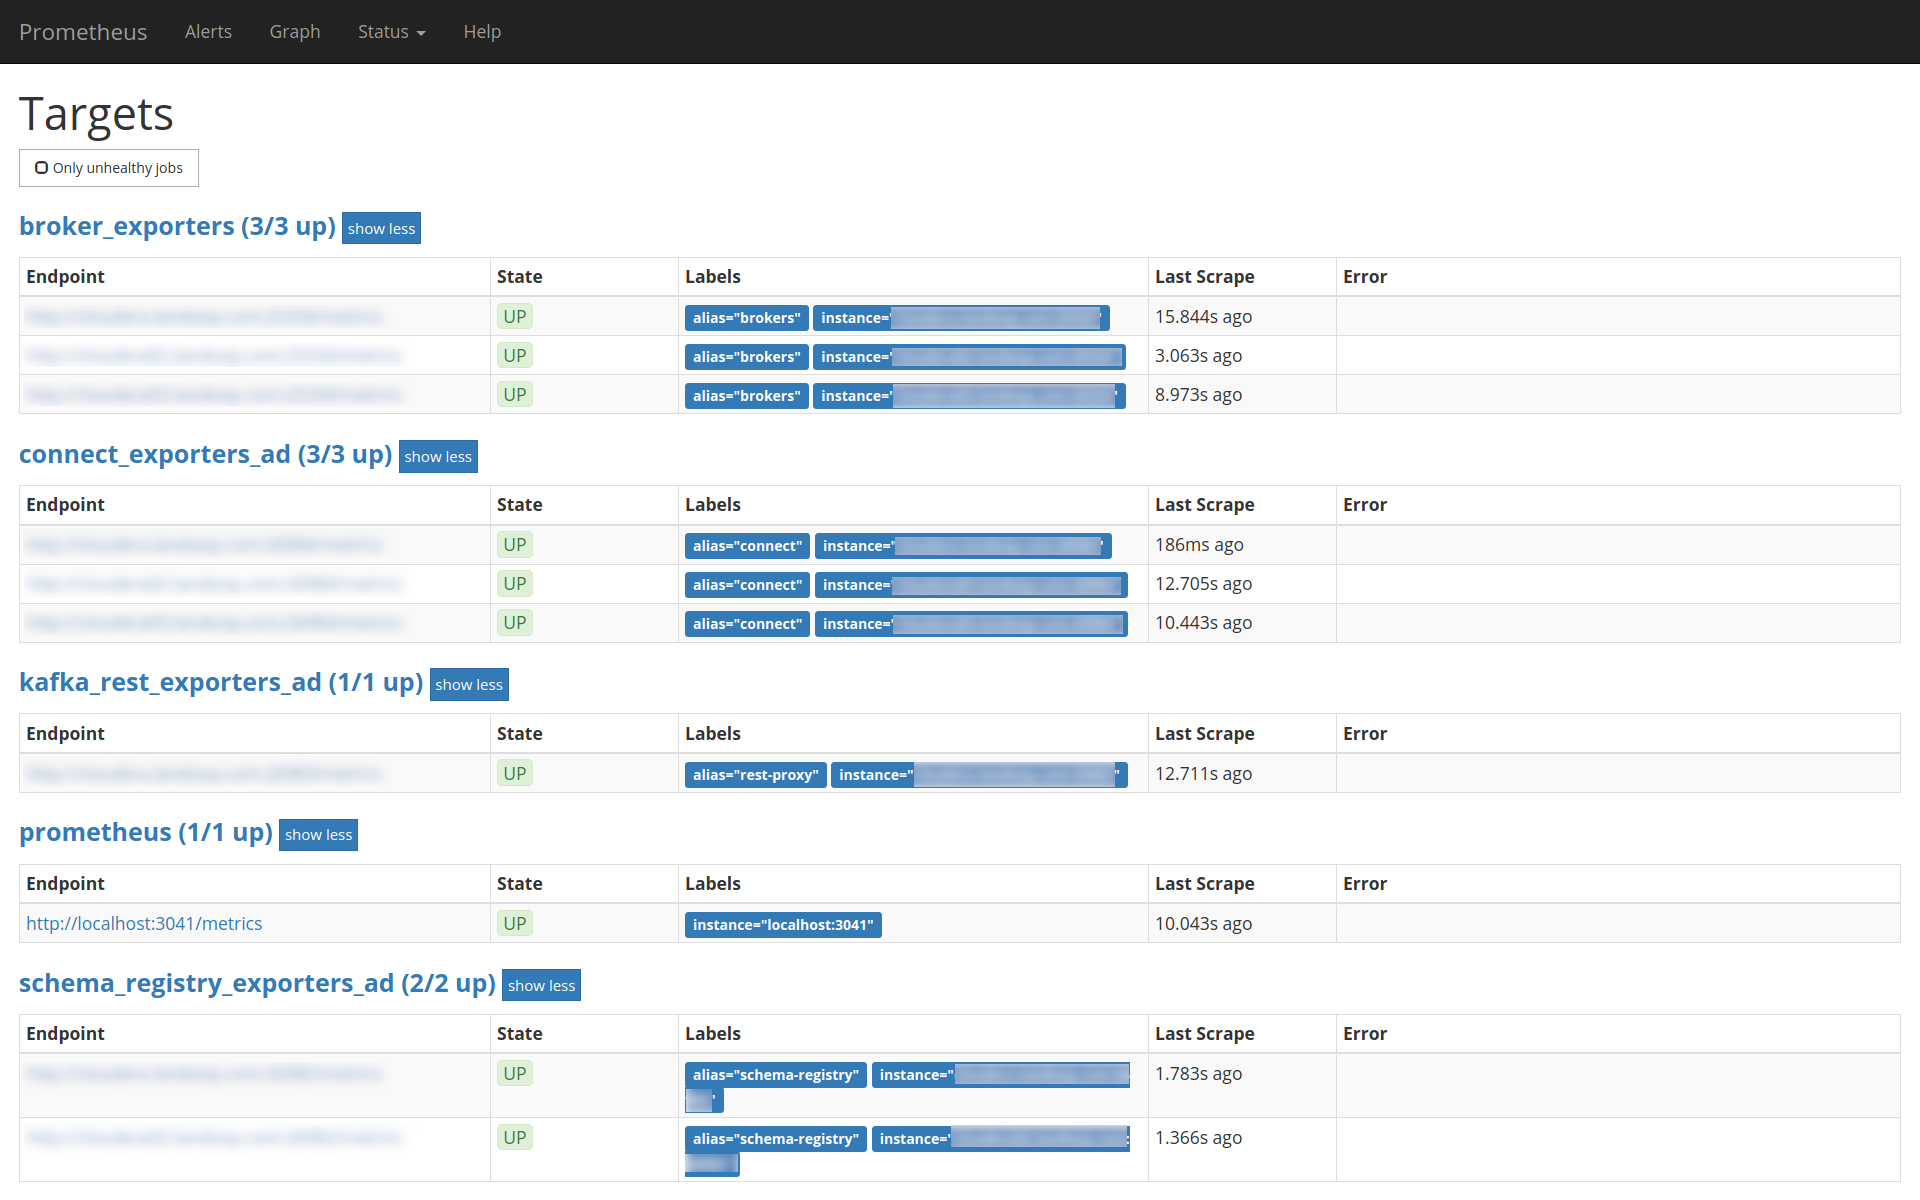
In this setup, there are broker metrics in Fast Data Monitoring,
whilst metrics for the rest of the services are exported automatically
via the fd.monitoring.prometheus. Notice how prometheus adds
the suffix _ad to these services, to show that it autodetected
them via the Endpoint Exporter.