3.3. Application Monitoring
Monitoring your long running Kafka applications can be an important aspect of your Kafka setup; you can detect runtime issues and act before they arise to incidents, use the information for debugging and be confident in your deployment.
Fast Data Monitoring includes a special command line tool for this purpose, fast_data_monitoring, which can be seen as a replacement for the java program. It augments your JVM-based application with a java agent that you can then add to Prometheus via Cloudera Manager. Landoop’s agent monitors both your application’s Kafka metrics, but also operational metrics, such as memory used and open file descriptors.
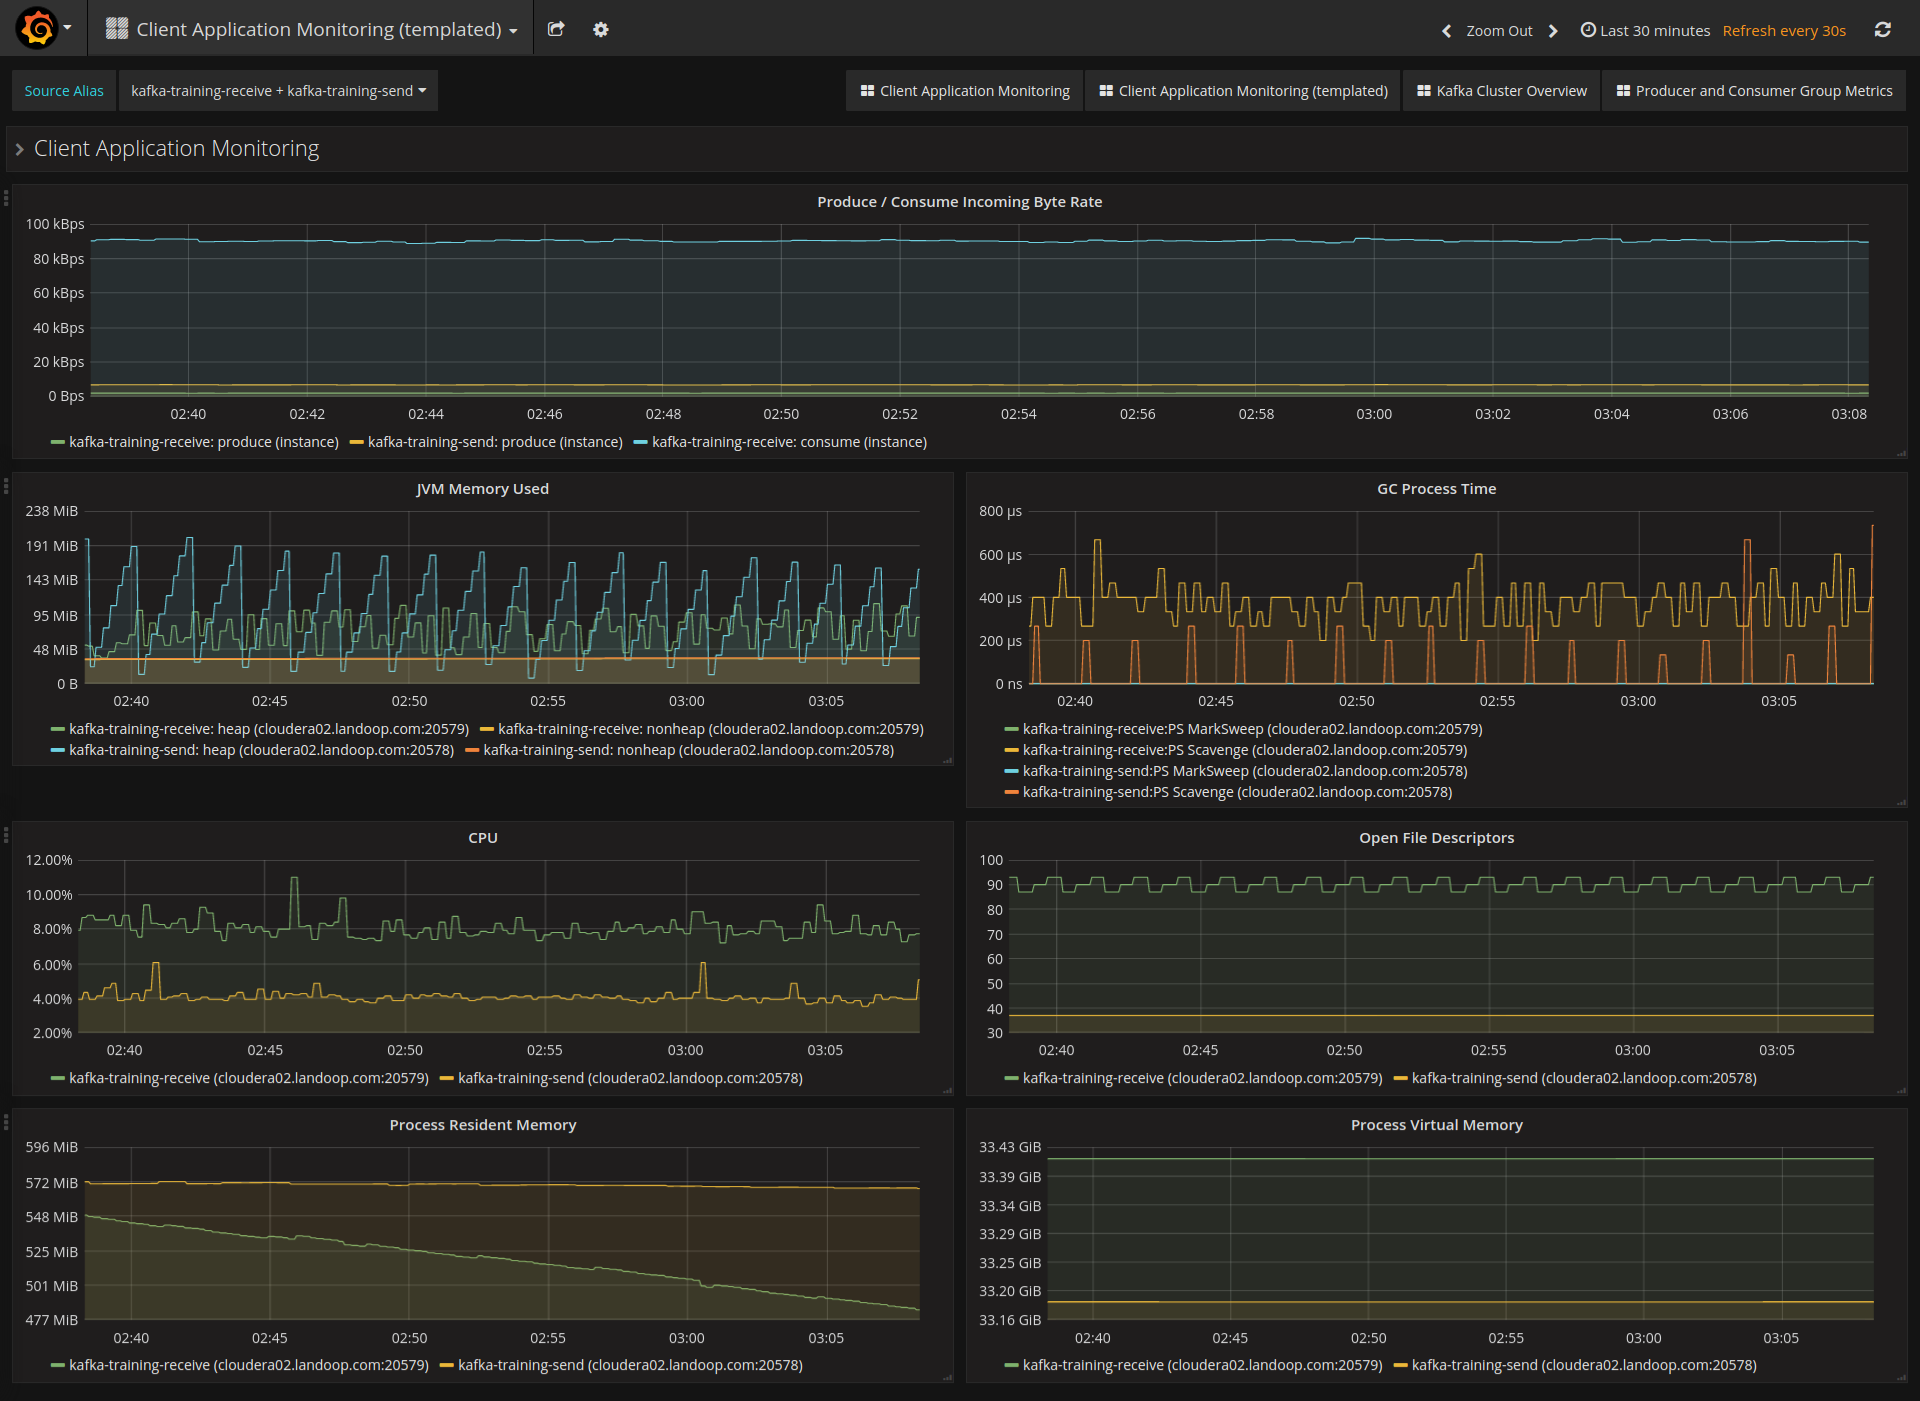
Client Application Monitoring dashboard
3.3.1. Monitoring an Application running on a Cluster node
We will explain how fast_data_monitoring works via an example. Bob has a Kafka application that he normally runs as:
java -cp avro-generator.jar com.landoop.avrogenerator.SimpleAvroProducer
To augment the application with a metrics exporter, he need to set the port
where the exporter will listen to and replace java with
fast_data_monitoring:
FDM_PORT=20577 fast_data_monitoring -cp avro-generator.jar com.landoop.avrogenerator.SimpleAvroProducer
Then he can proceed to add his application to Prometheus, via the user.targets
setting of Prometheus in Cloudera Manager. He can optionally add an alias for
his application:
<IP_ADDRESS>:<FDM_PORT>[;<APP_ALIAS>]
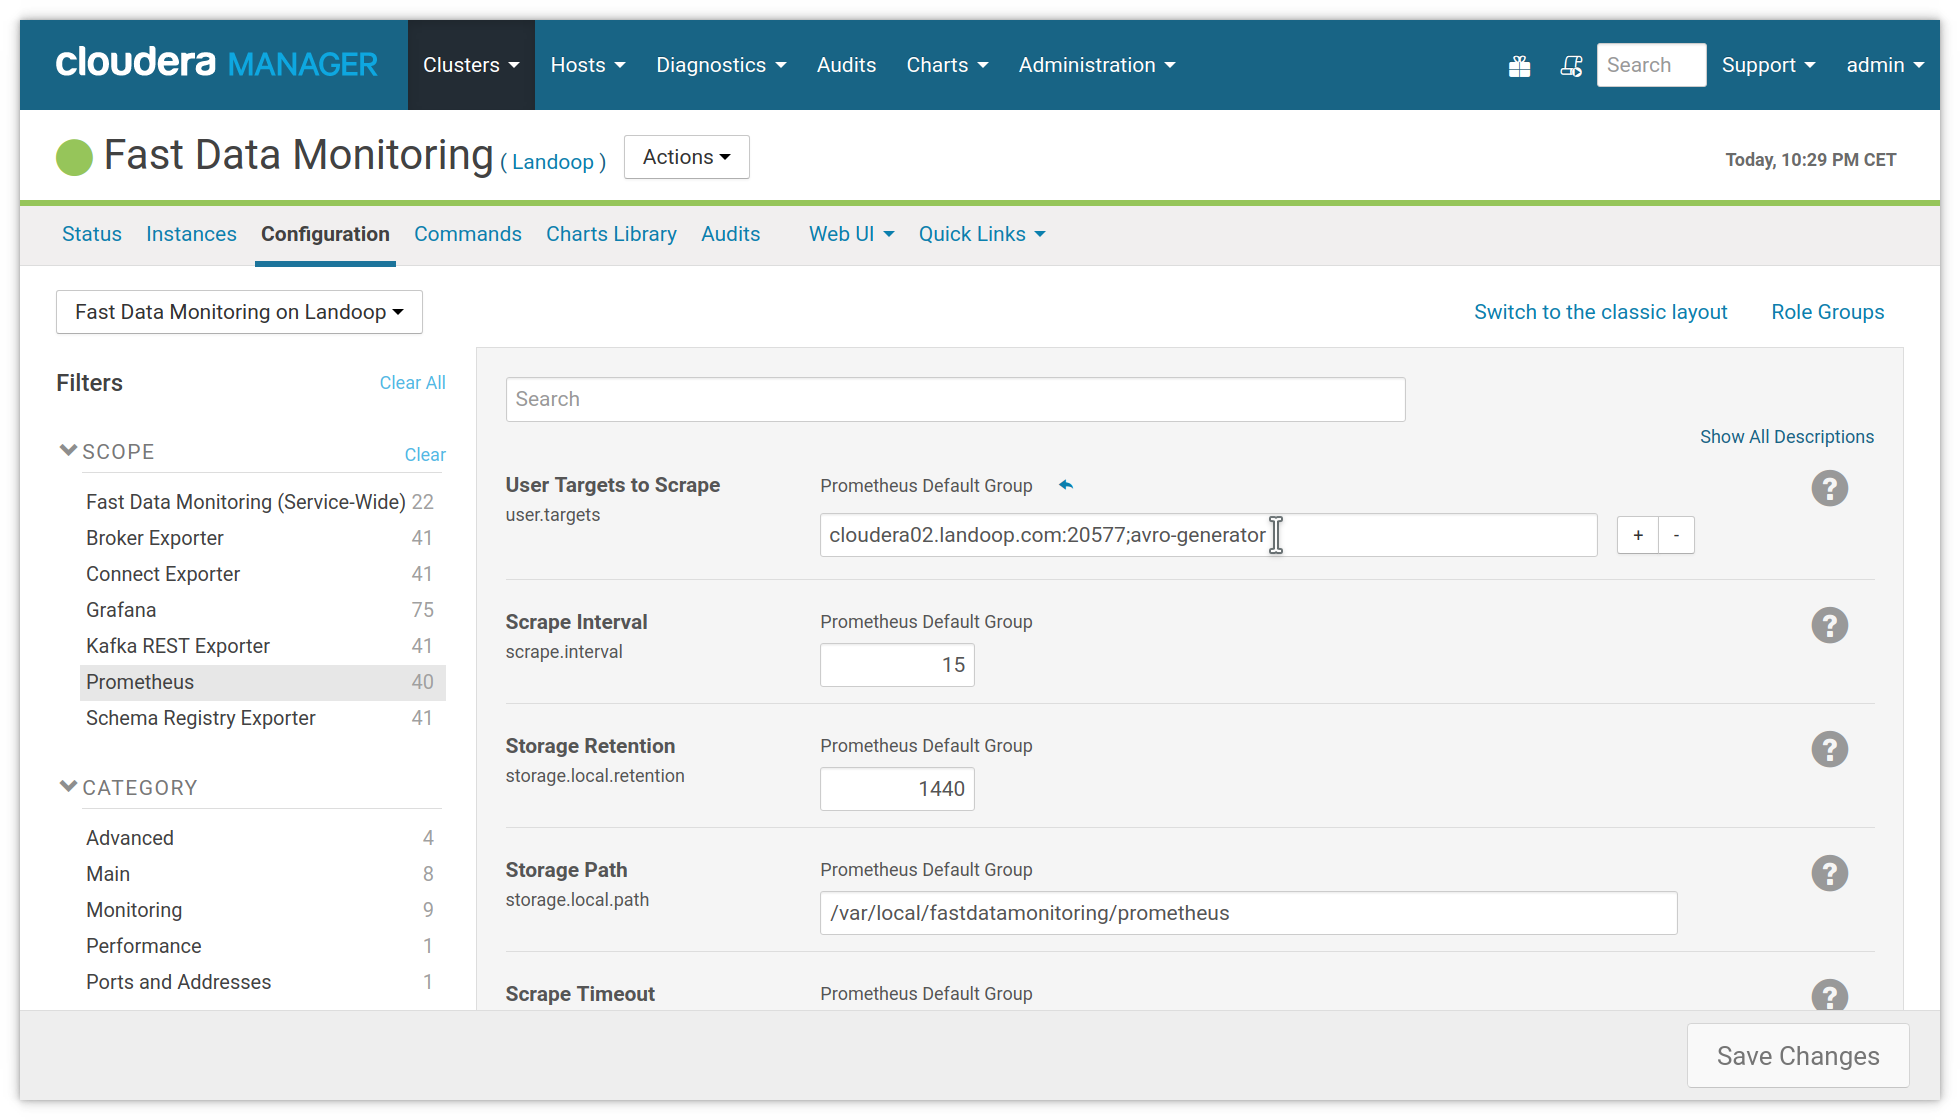
Adding Client Applications to Prometheus
3.3.2. Monitoring an Application running Externally to the Cluster
If your application doesn’t run on a node of your Cloudera cluster, the fast_data_monitoring command won’t be available. You can get instead our exporter jar and configuration instead at our tools repository.
Inside the archive you will find fastdata_agent.jar [1] and exporter.yml. You can use them to export JMX metrics of your application to Prometheus format.
In Bob’s example we already saw:
java -cp avro-generator.jar com.landoop.avrogenerator.SimpleAvroProducer
We would use our tools like below. Please note how we set the port where we will expose the metrics:
java -javaagent:fastdata_agent.jar=25077:exporter.yml -cp avro-generator.jar com.landoop.avrogenerator.SimpleAvroProducer
The process to add the application to Prometheus, is the same as before.
| [1] | fastdata_agent.jar is Landoop’s version of Prometheus’ jmx_exporter agent. For now, these two are interchangeable. |