3.4. Troubleshooting
Contents
3.4.1. No data source in Grafana
Grafana doesn’t support pre-configured data sources. As it is essential for us to give you a turnkey solution, we have developed a custom process to automatically setup Grafana with your Prometheus instance as a data source. Unfortunately it may fail sometimes. In such cases you have to add your Prometheus manually.
Inside Grafana visit Data Sources and click Add data source. Then configure it as shown below. The name property is important as it is used to set the source for the graphs in our dashboards. Usually it is the name of the Prometheus host. The URL is your Prometheus’ URL.
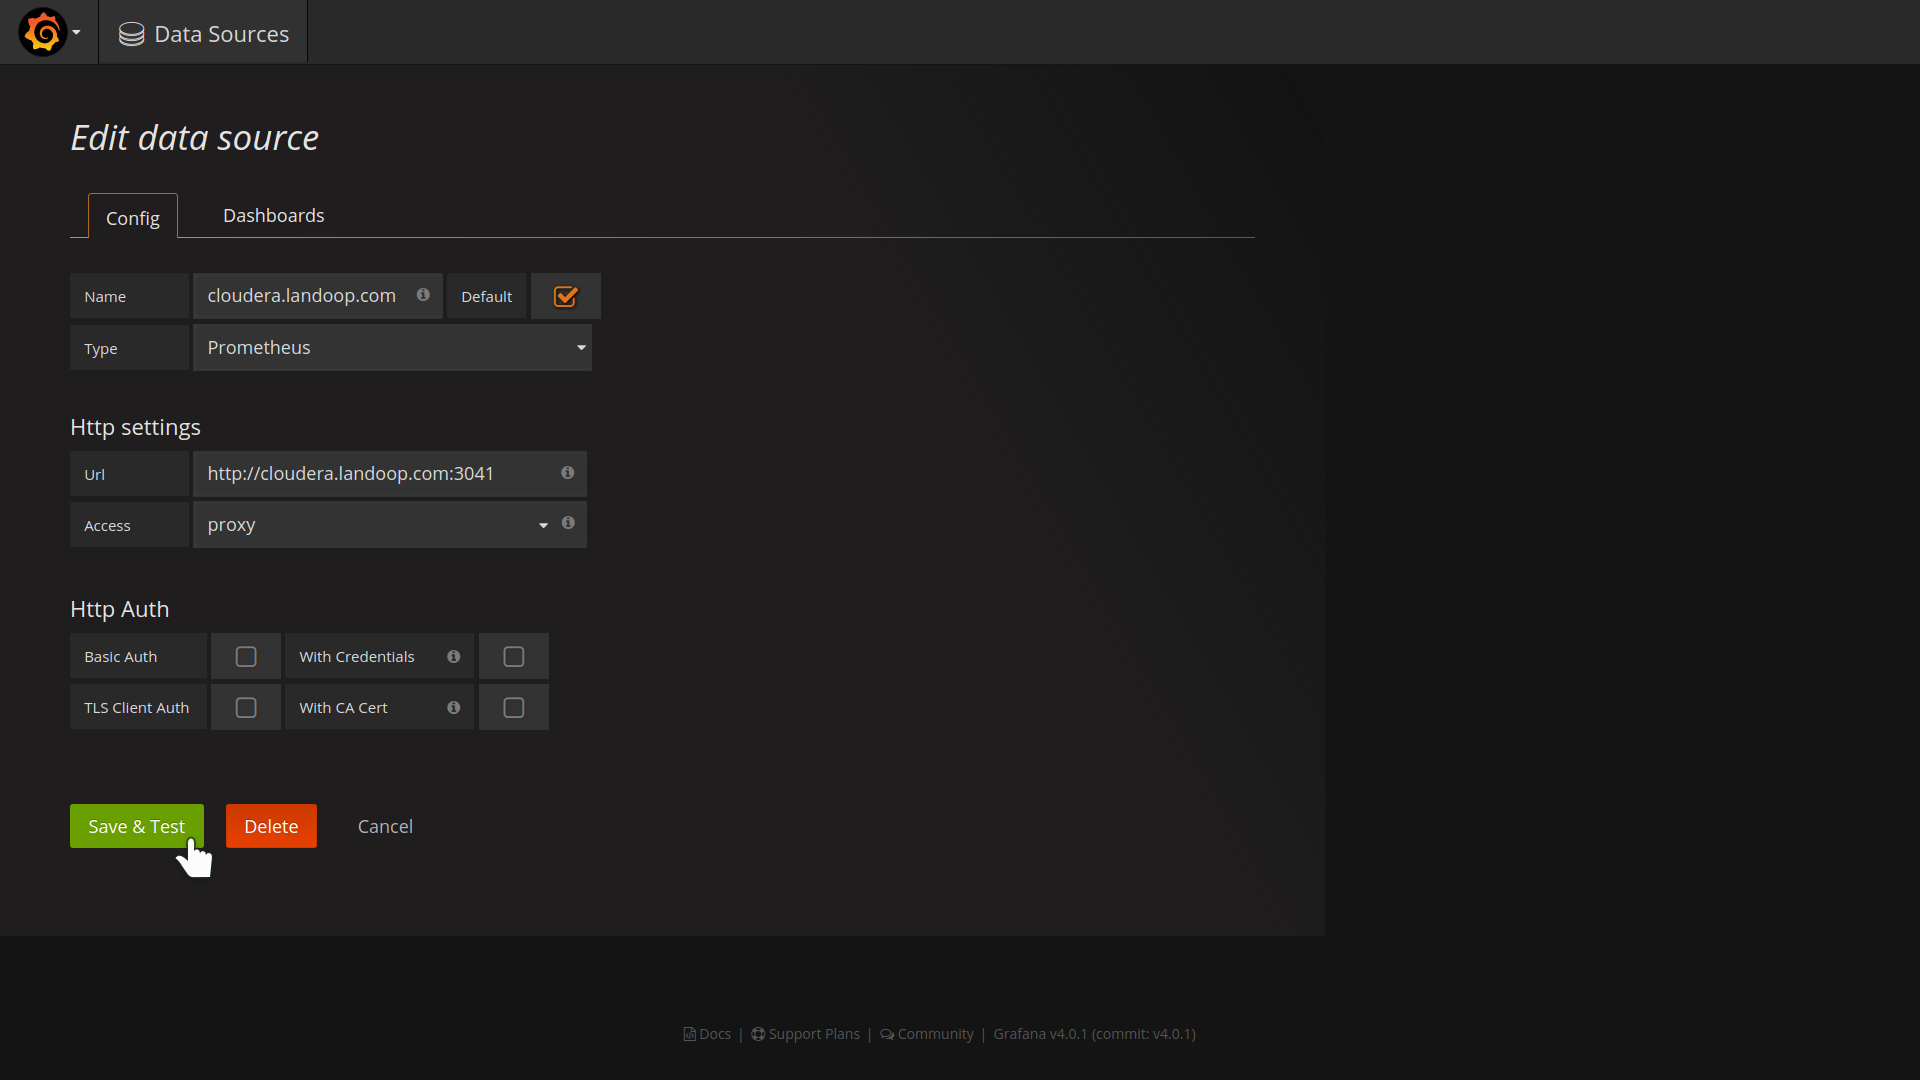
Manually create a datasource in Grafana
If you have trouble finding the proper name for your datasource, visit one dashboard and edit a graph. The name of the source will be at the metrics tab.
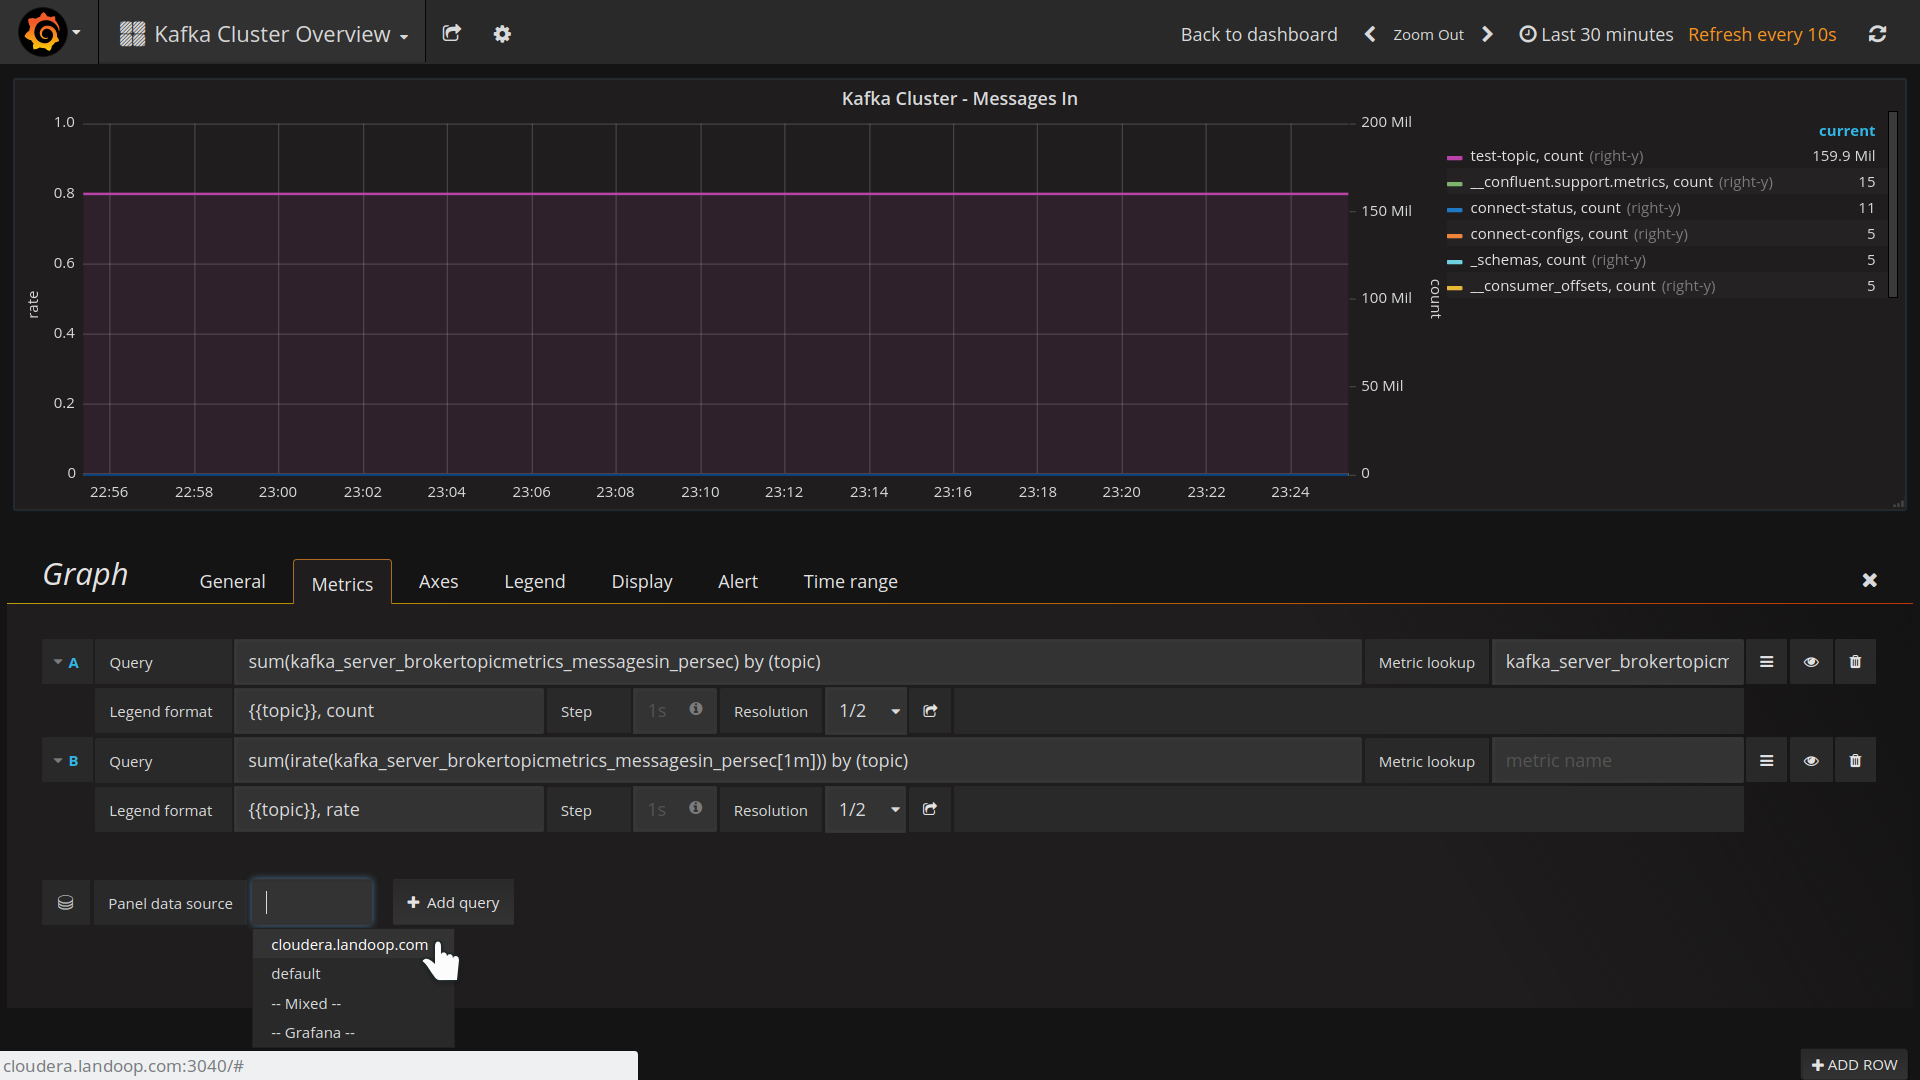
The data source name is available at the metrics tab of a graph.
Grafana depends on a user’s computer clock in order to request data for periods spanning from now to some time back. If your computer’s clock is out of sync (e.g it is running fast), it may return bad data.