3.2. Security
Fast Data Monitoring (FDM) is used to monitor your Kafka Cluster and optionally send alerts when metrics are out of your acceptable thresholds. In that way the FDM cannot interact with your Kafka Cluster as it is a read-only, JMX metrics consumer. There can be security incidents though and it is up to the cluster administrator to put safety measures in place.
In this chapter we will go over the FDM’s components, the possible ways each may be used in a malicious manner and how you can keep them secure.
Contents
3.2.1. Exporters
Exporters are stateless agents that read JMX metrics from a JVM based application and expose them over http in Prometheus’ Exposition Text Format. They are based on the jmx_exporter.
Metrics exported include topic names and message rates for each topic, which may help someone understand your Kafka infrastructure. As such, the exporters should only be accessible by the Prometheus host. Prometheus essentially is a timeseries database tailored to monitoring. It uses a scrape logic to pull data from the exporters. Another danger with open to everyone exporters, is a DoS attack by performing multiple requests to the exporters.
The default ports for the exporters are:
broker exporter 25334 registry exporter 25335 kafka rest exporter 25336 connect exporter 25337
Important
Use a firewall to protect your exporters. Ideally only Prometheus should have access to them.
3.2.2. Prometheus
Prometheus, as mentioned, is the metrics storage database. As such, only the Grafana host needs access to it.
Prometheus provides a HTTP REST interface for querying as well as a basic web interface. As it keeps all the metrics, it can expose various interesting information about your cluster, such as topics names, number of brokers, rates of messages per topic. It may be important to keep this information secret.
An open Prometheus interface can also be used as a DoS attack surface. By performing queries, an attacker may create high CPU, disk and memory usage.
Prometheus default port is 3041.
Important
Use a firewall to protect your Prometheus’ instances. Ideally only Grafana should have access to them.
3.2.3. Grafana
Grafana is used for dashboards and alerts. By default it is served over http and
provides authentication via its inbuild mechanisms. The default account is
admin with password admin. Obviously changing the default password and
adding users with limited rights is the first step an administrator should take
after creating a FDM service. Optionally you can set https.
If a malicious user manage to login to Grafana, he/she will be able to view your metrics (including topic names, rates, etc), perform queries to Prometheus and depending on the level of access, create or alter your dashboards and most importantly your alerts.
Important
Use a firewall to protect your Grafana from unwanted visitors. Change the default administrator password and create user accounts with proper rights for your personnel.
3.2.3.1. Enable TLS/SSL
To enable https for Grafana you need a key-certificate pair in pem format. Visit Grafana’s security settings in Cloudera Manager to enable SSL and set the key and certificate.
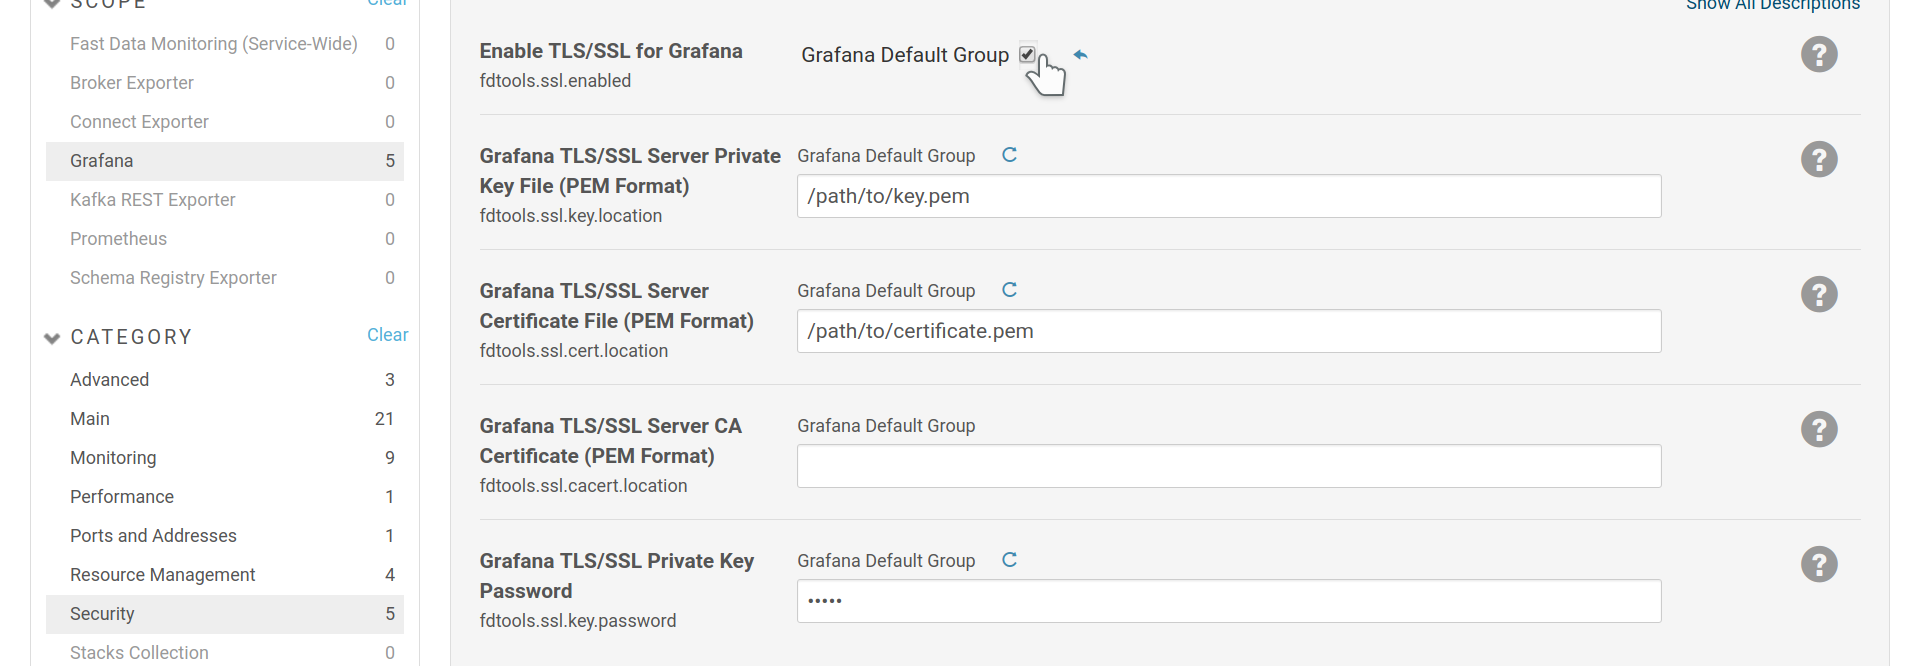
Enable SSL for Grafana.
The fdtools.ssl.cacert.location is optional and should include the CA chain
for your certificate. Often the chain is included in the certificate and this
option can stay empty.