3.1. Installation
Contents
3.1.1. Add CSD to Cloudera Manager
To install Landoop’s Fast Data Monitoring CSD all you have to do is copy a small jar file into your Cloudera CSD directory and restart Cloudera Manager. The CSD is available upon request.
Important
Fast Data Monitoring is currently available only for Linux x86_64 hosts. If you are on a different architecture or a 32bit OS and interested to try Fast Data Monitoring contact us.
It is up to the cluster administrator to copy the CSD to the server that hosts the Cloudera Manager. For reference, in a vanilla Cloudera installation, you would first ssh into the server that houses the Cloudera Manager and run:
sudo wget https://url/of/fast-data-monitoring.jar \
          -O /opt/cloudera/csd/FASTDATAMONITORING-1.2-release-0.jar
sudo chown cloudera-scm:cloudera-scm /opt/cloudera/csd/FASTDATAMONITORING-1.2-release-0.jar
If you installed cloudera to a different directory adjust accordingly.
Next you have to either restart CM (Cloudera Manager) or use CM’s CSD API to install without restart. The command line to restart CM depends on your Linux distribution of choice. For most modern distributions which rely on systemd, you would run something like:
sudo systemctl restart cloudera-scm-server
If you prefer the API, you should visit the following two locations in order. The first asks CM to reload the CSD list and the second to install Landoop’s Fast Data Tools CSD. Cloudera strongly recommends to avoid this method as the CSD may not work properly until CM restart:
http://cloudera.manager.server:7180/cmf/csd/refresh
http://cloudera.manager.server:7180/cmf/csd/install?csdName=FASTDATAMONITORING-1.2-release-0.jar
Once you complete the above steps, two things will change in your CM; it now includes a Fast Data Monitoring service type and also has Landoop’s repository for the Fast Data Monitoring Parcel, that installs the tools needed for monitoring (grafana, prometheus and jmx exporters).
Note
If you want Grafana to render properly graphs in alerts (these graphs will be embedded to email and/or slack notifications), you have to make sure freetype, fontconfig and urw-fonts are installed in your grafana node. In our experience usually just urw-fonts will be missing from a server install.
You are ready to proceed to Add a Fast Data Monitoring Service.
3.1.2. Add a Fast Data Monitoring Service
The CSD installation made your CM aware of the Fast Data Monitoring programs and their management. You may use CM now to install the actual software to your cluster hosts and then setup the service.
3.1.2.1. Install the Parcel
A parcel is a package format for Cloudera Manager. It contains both files and system setup instructions. We provide a range of Confluent parcels for various Linux x86_64 distros.
The Fast Data Monitoring CSD you installed earlier, added the parcel repository and now you can install our parcel directly from CM’s parcel management page.
At the parcel management page of your Cloudera Manager you proceed to download, distribute and activate the Fast Data Monitoring parcel.
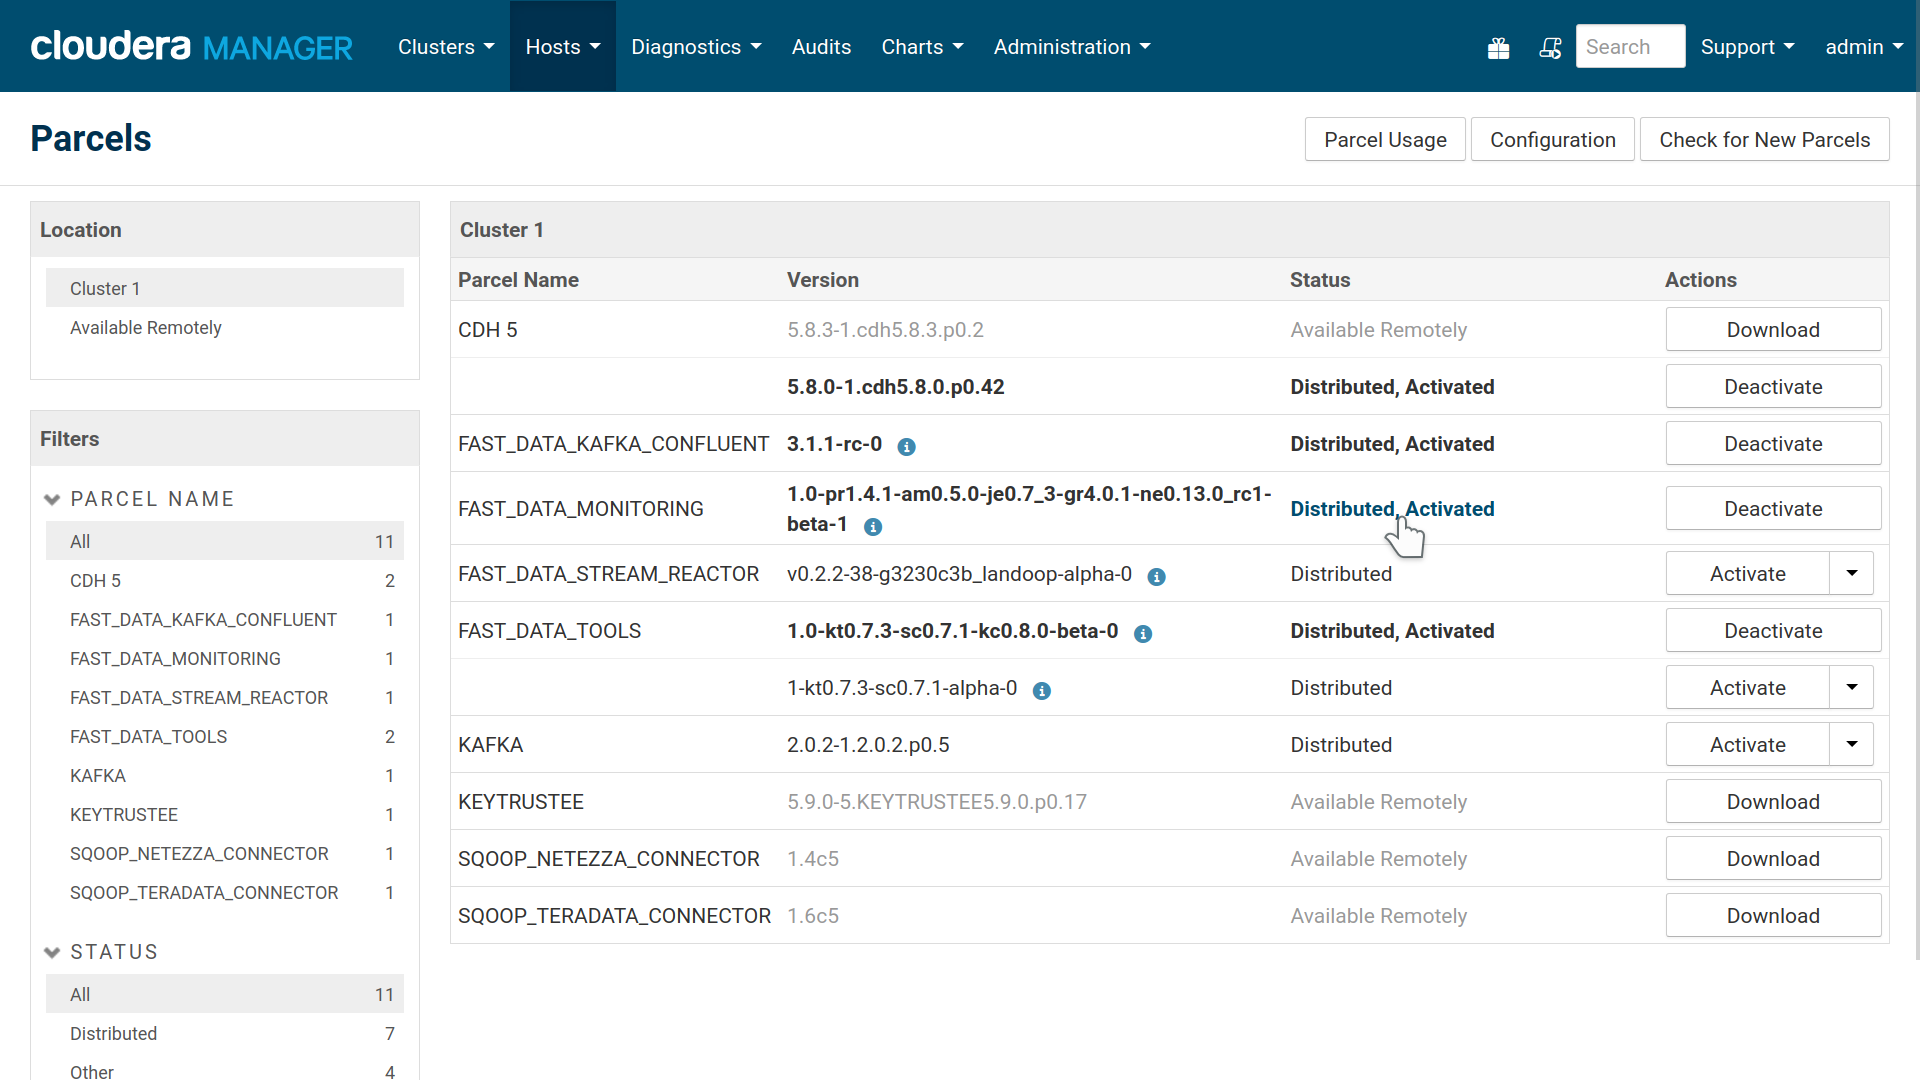
Fast Data Monitoring Parcel available in Cloudera Manager
Note
If your cluster does not have internet access, Cloudera provides alternative installation methods. Please consult Cloudera’s documentation
3.1.2.2. Add a Service Instance
A service is a set of roles running on one or more cluster hosts, managed by CM. Our CSD provides the following roles:
- Grafana
- Prometheus
- Broker Exporter
- Schema Registry Exporter
- Kafka REST Exporter
- Connect Exporter
All the exporters are stateless. Prometheus and Grafana do store data and settings. Prometheus stores metrics. Their size will vary depending on use. On a not very busy cluster with 3 kafka brokers, 3 schema registries, 3 connect workers and 1 kafka rest we measure about 3GiB of data per day. Our default metrics retention period is 60 days. The decision whether you need redundancy for your metrics, falls upon you cluster administrator. Prometheus doesn’t offer replication but you may setup multiple instances and each one will scrape the exporters and keep data independently of the others.
Grafana keeps a database of users, their settings and dashboards. You should
expect a few megabytes at most. It is not possible to offer replication so it is
up to your users and/or administrator to backup periodically your grafana
data. They are stored under /var/local/fastdatamonitoring/grafana.
To start with a Fast Data Monitoring service, inside CM, at your cluster’s menu, select add a service.
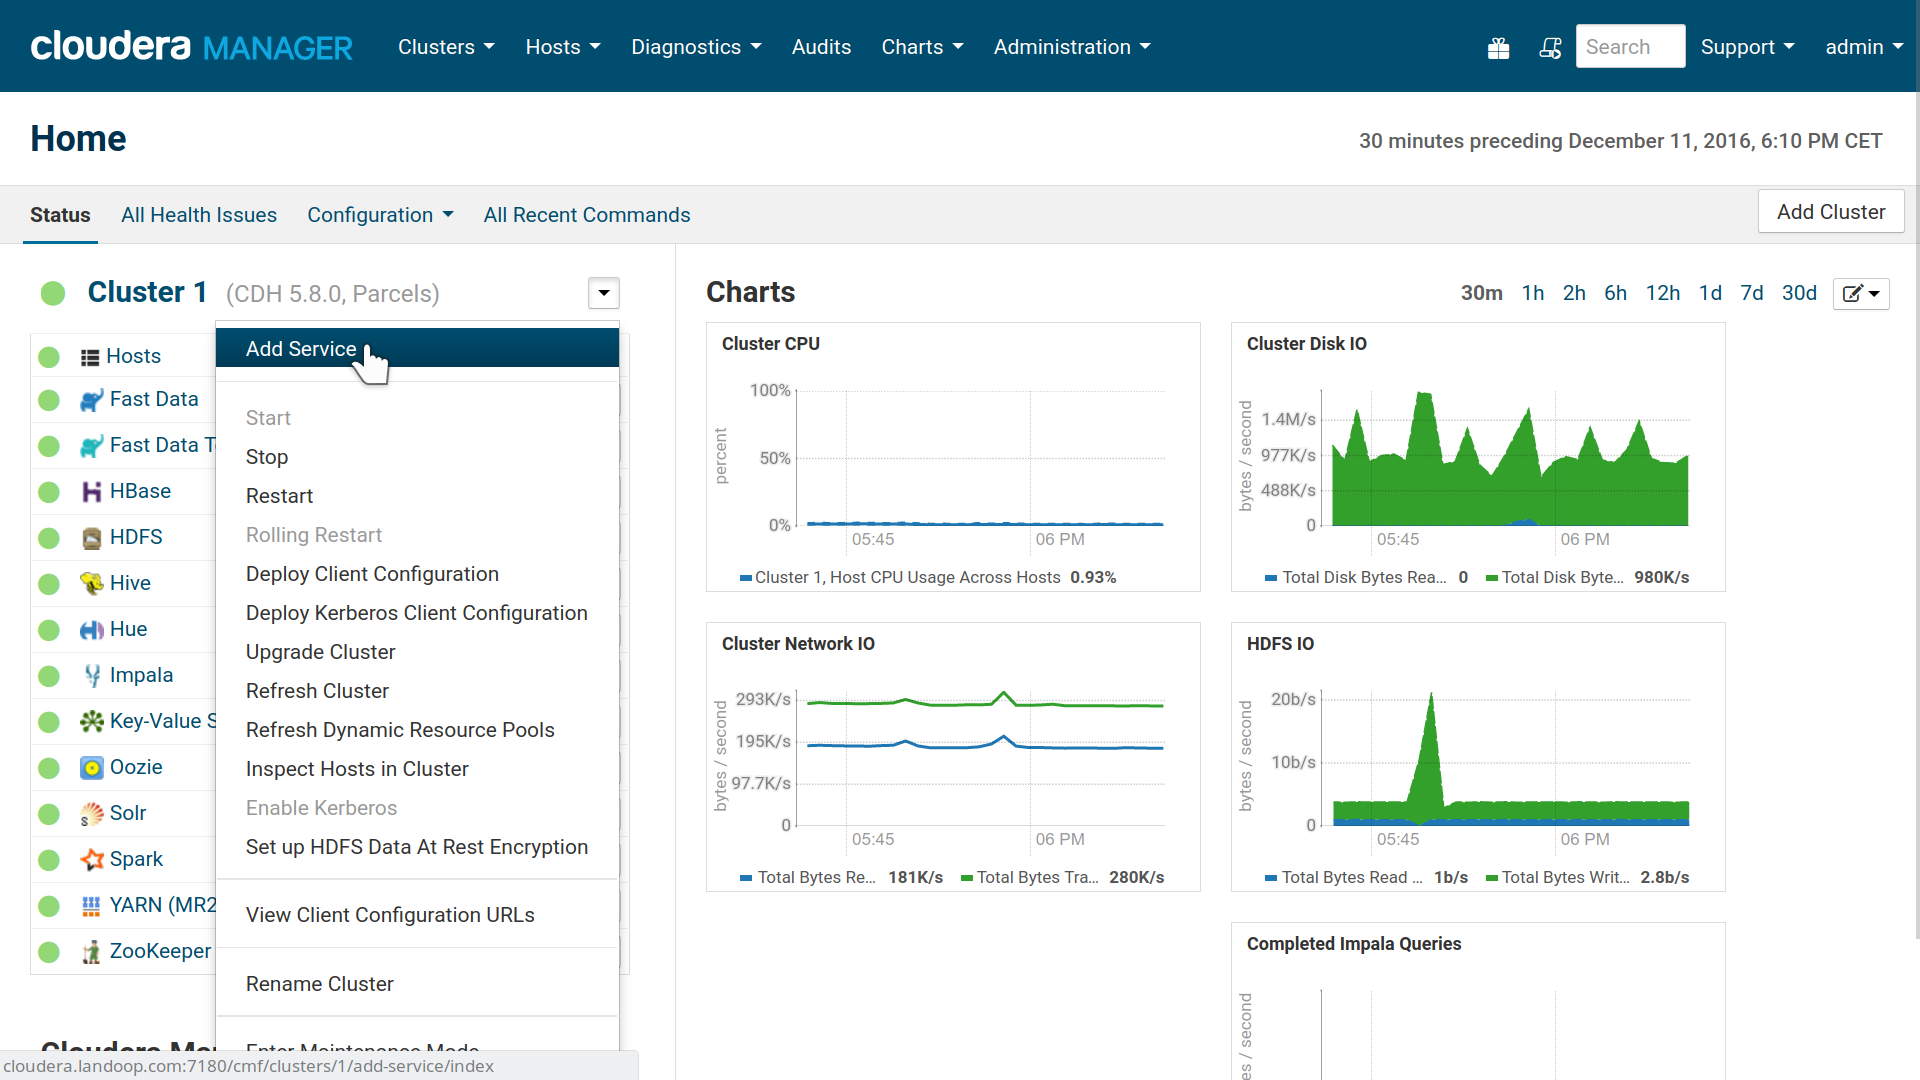
Cloudera Manager, Add a Service
At the first step, choose Fast Data Monitoring.
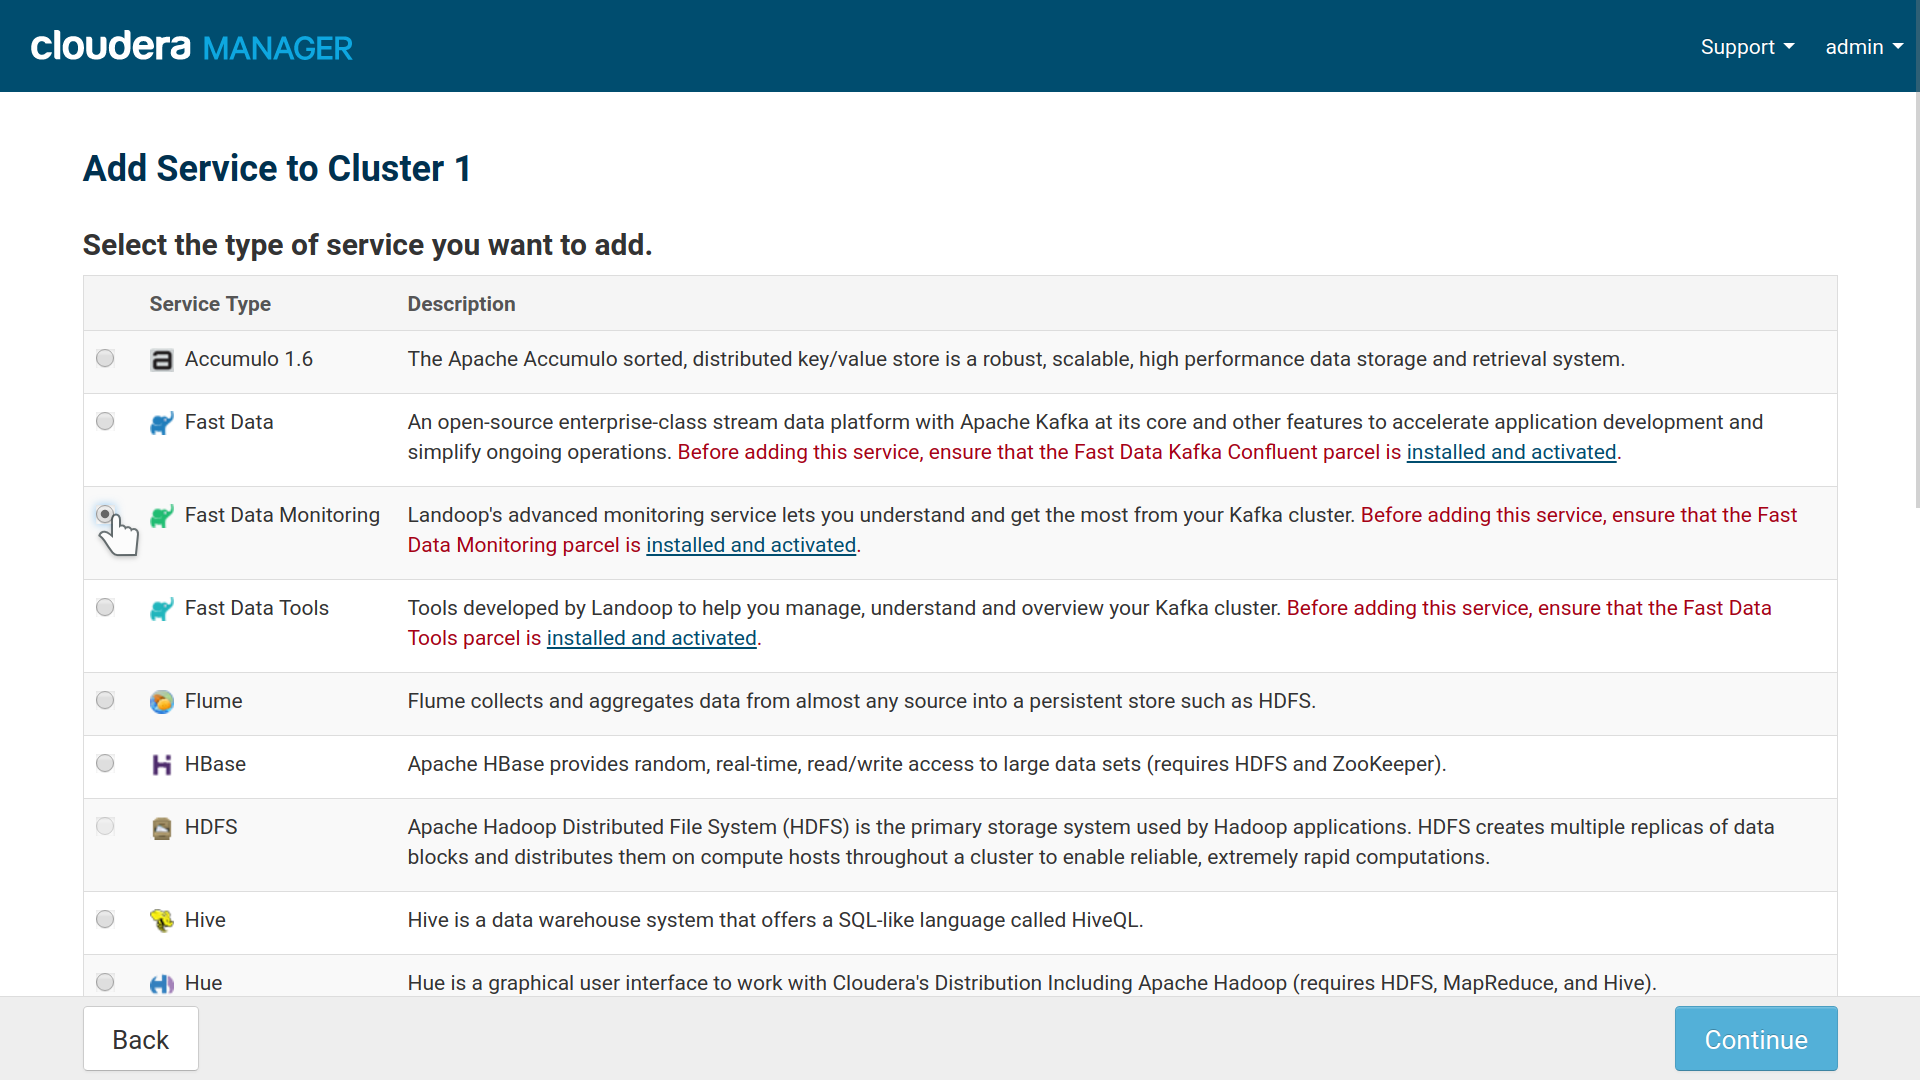
Fast Data Monitoring service installation option in Cloudera Manager
The second step asks you to assign roles. Grafana and Prometheus aren’t distributed software so you need one instance of each. You may add more prometheus instances for redundancy and each instance will scrape separately the exporters for data. You will have to adjust your grafana —either at the datasource level or dashboard/graph level— to switch between the two.
Exporters must live in the same node the services they monitor live. So in all your kafka brokers nodes, you should add broker exporters. In all your connect distributed nodes you should add connect exporters.
Optionally you could add all exporters to all your nodes, if an exporter doesn’t find the service it monitors, it won’t export anything, but it is a waste of resources running software you don’t need.
We took this approach which involves some manual settings in order to separate the Kafka service from the monitoring service. This way you can get updates for the monitoring software without having to restart your Kafka cluster.
Important
Exporters must live in the same node the services they monitor live. So in all your kafka brokers nodes, you should add broker exporters. In all your connect distributed nodes you should add connect exporters.
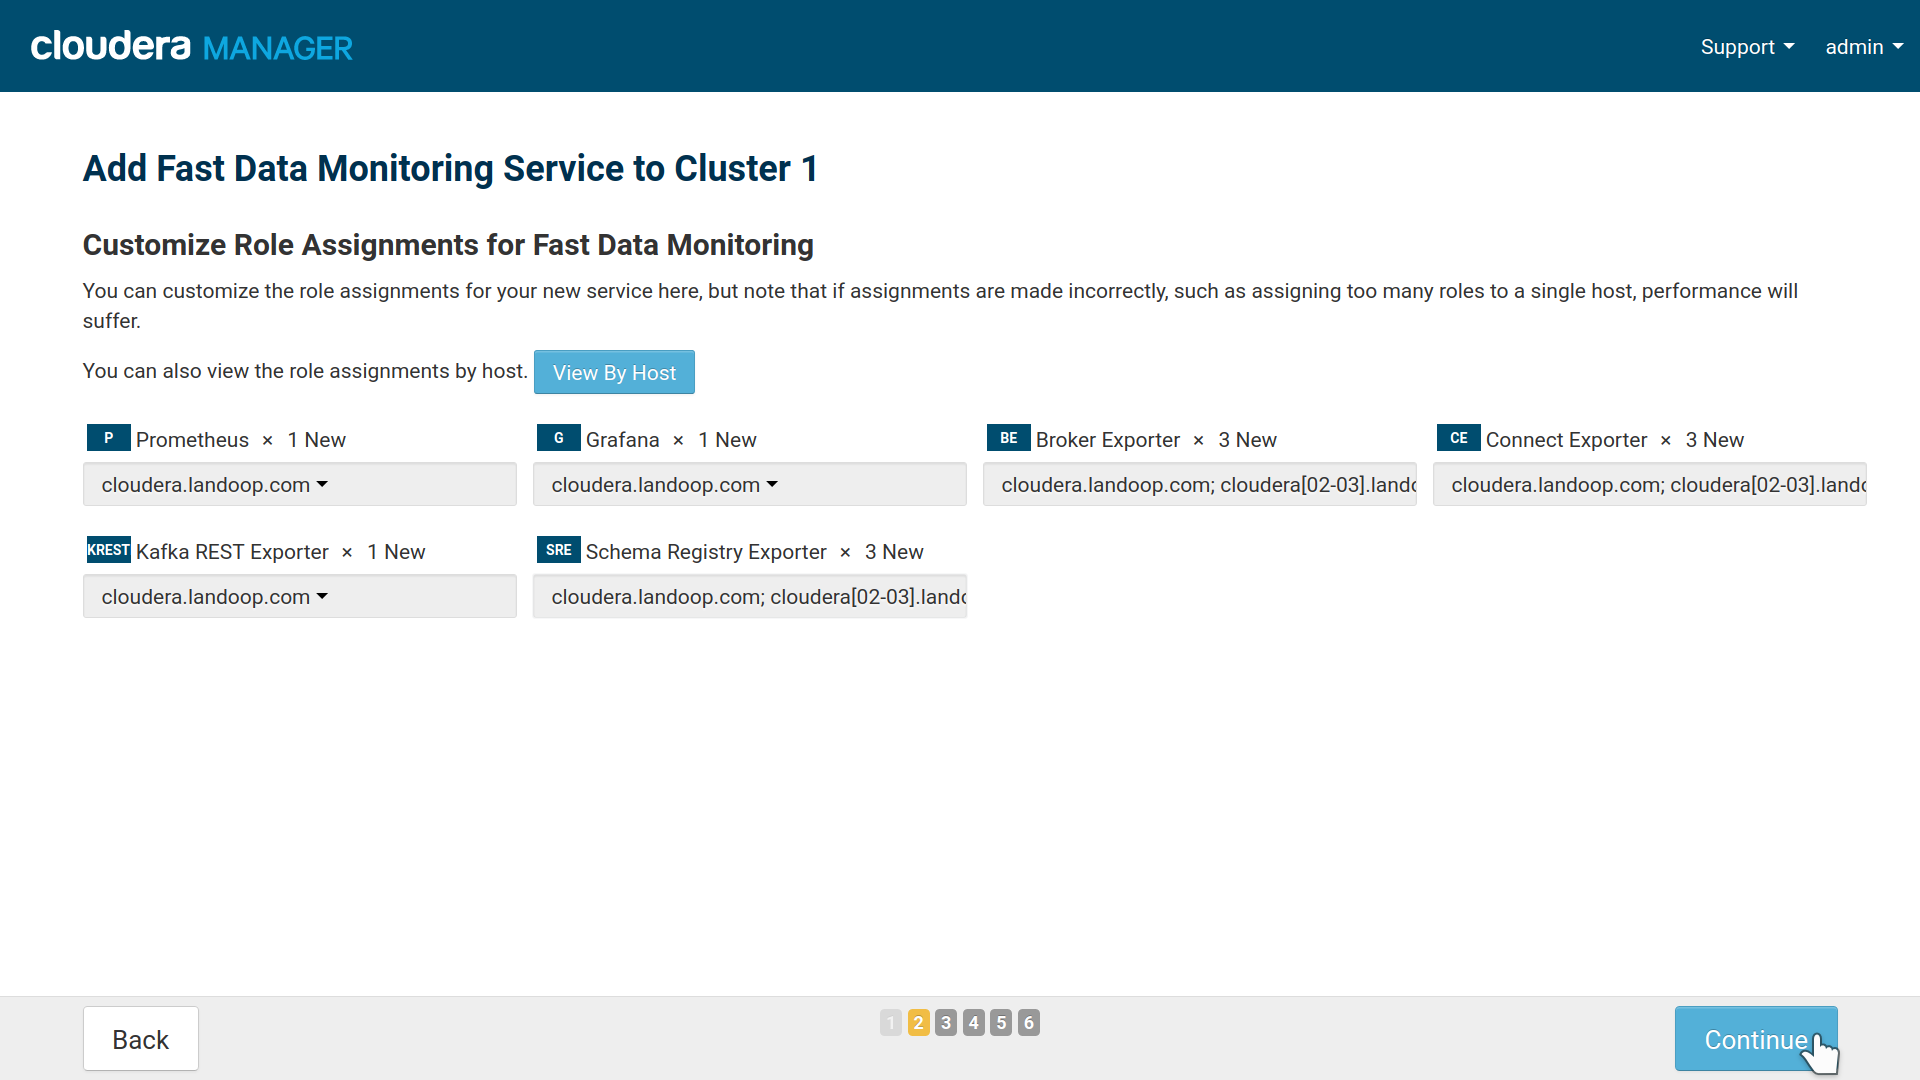
Fast Data Monitoring role, instances assignment
The third step has the main settings for your Fast Data Monitoring service. Usually you don’t have to change anything, unless you don’t use the default JMX ports for the Kafka services.
Some settings of interest in the wizard are the scrape interval (default 15 seconds) and the data retention period (Storage Retention, default 1440 hours/60 days). You can adjust them according to your needs or disk space limitations.
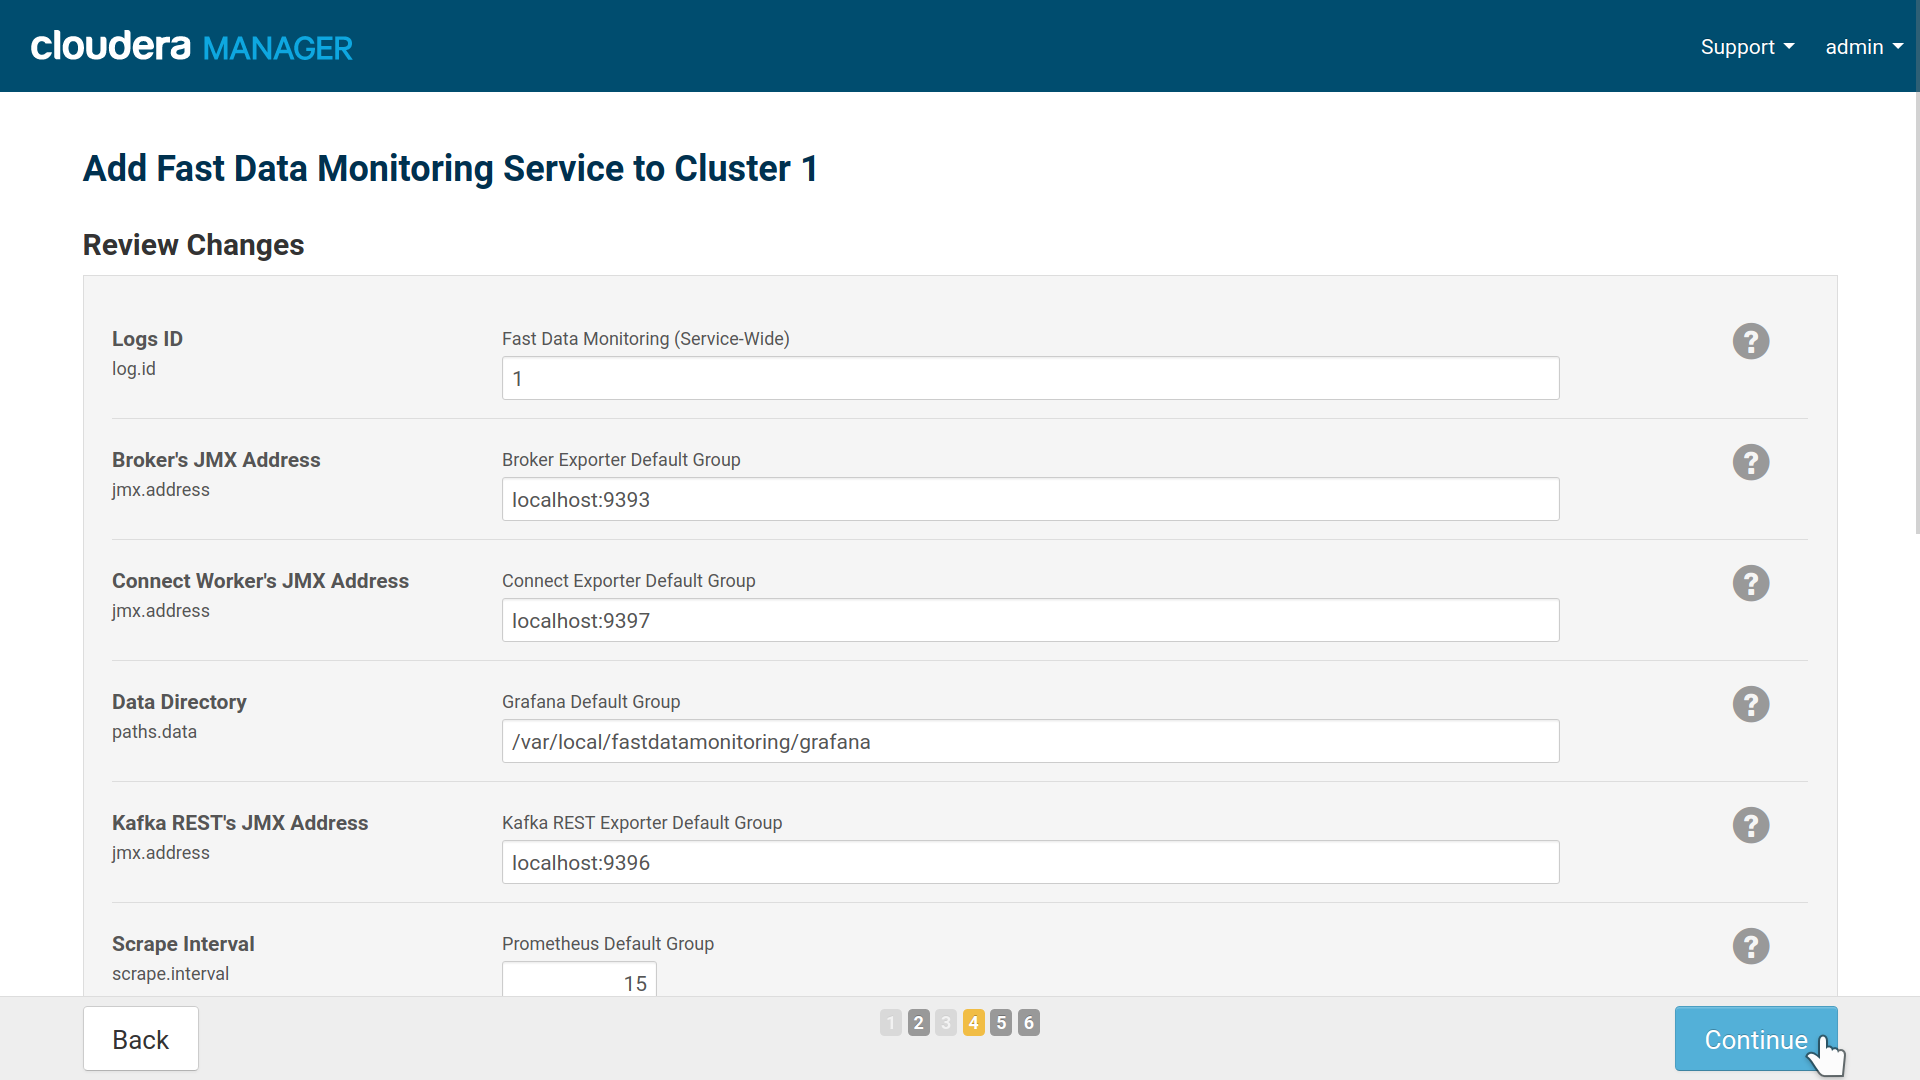
Cloudera Manager Install Wizard settings for Fast Data Monitoring.
The last step will start the roles you assigned if possible. In case it doesn’t start them or there are issues, you can leave the wizard and head straight to the service settings to start it or fix the issues.
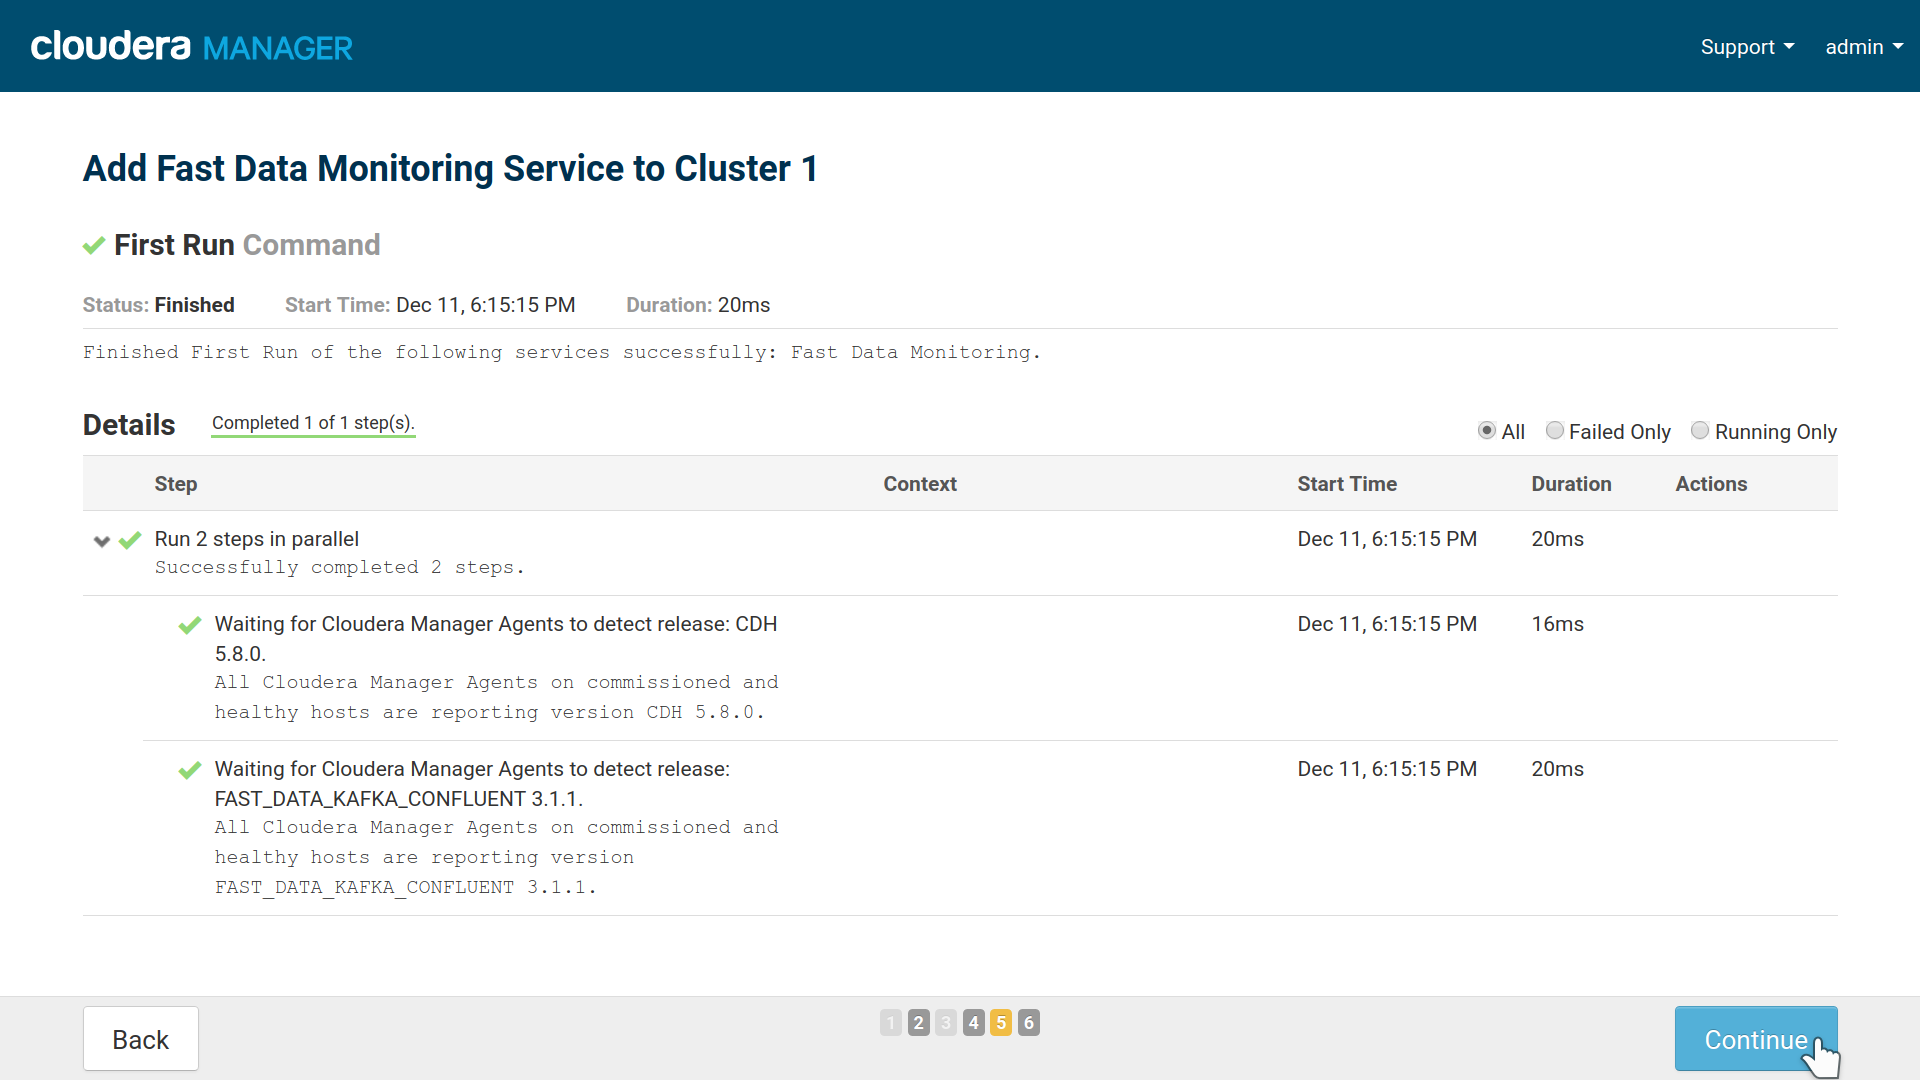
Fast Data Monitoring Service didn’t start automatically
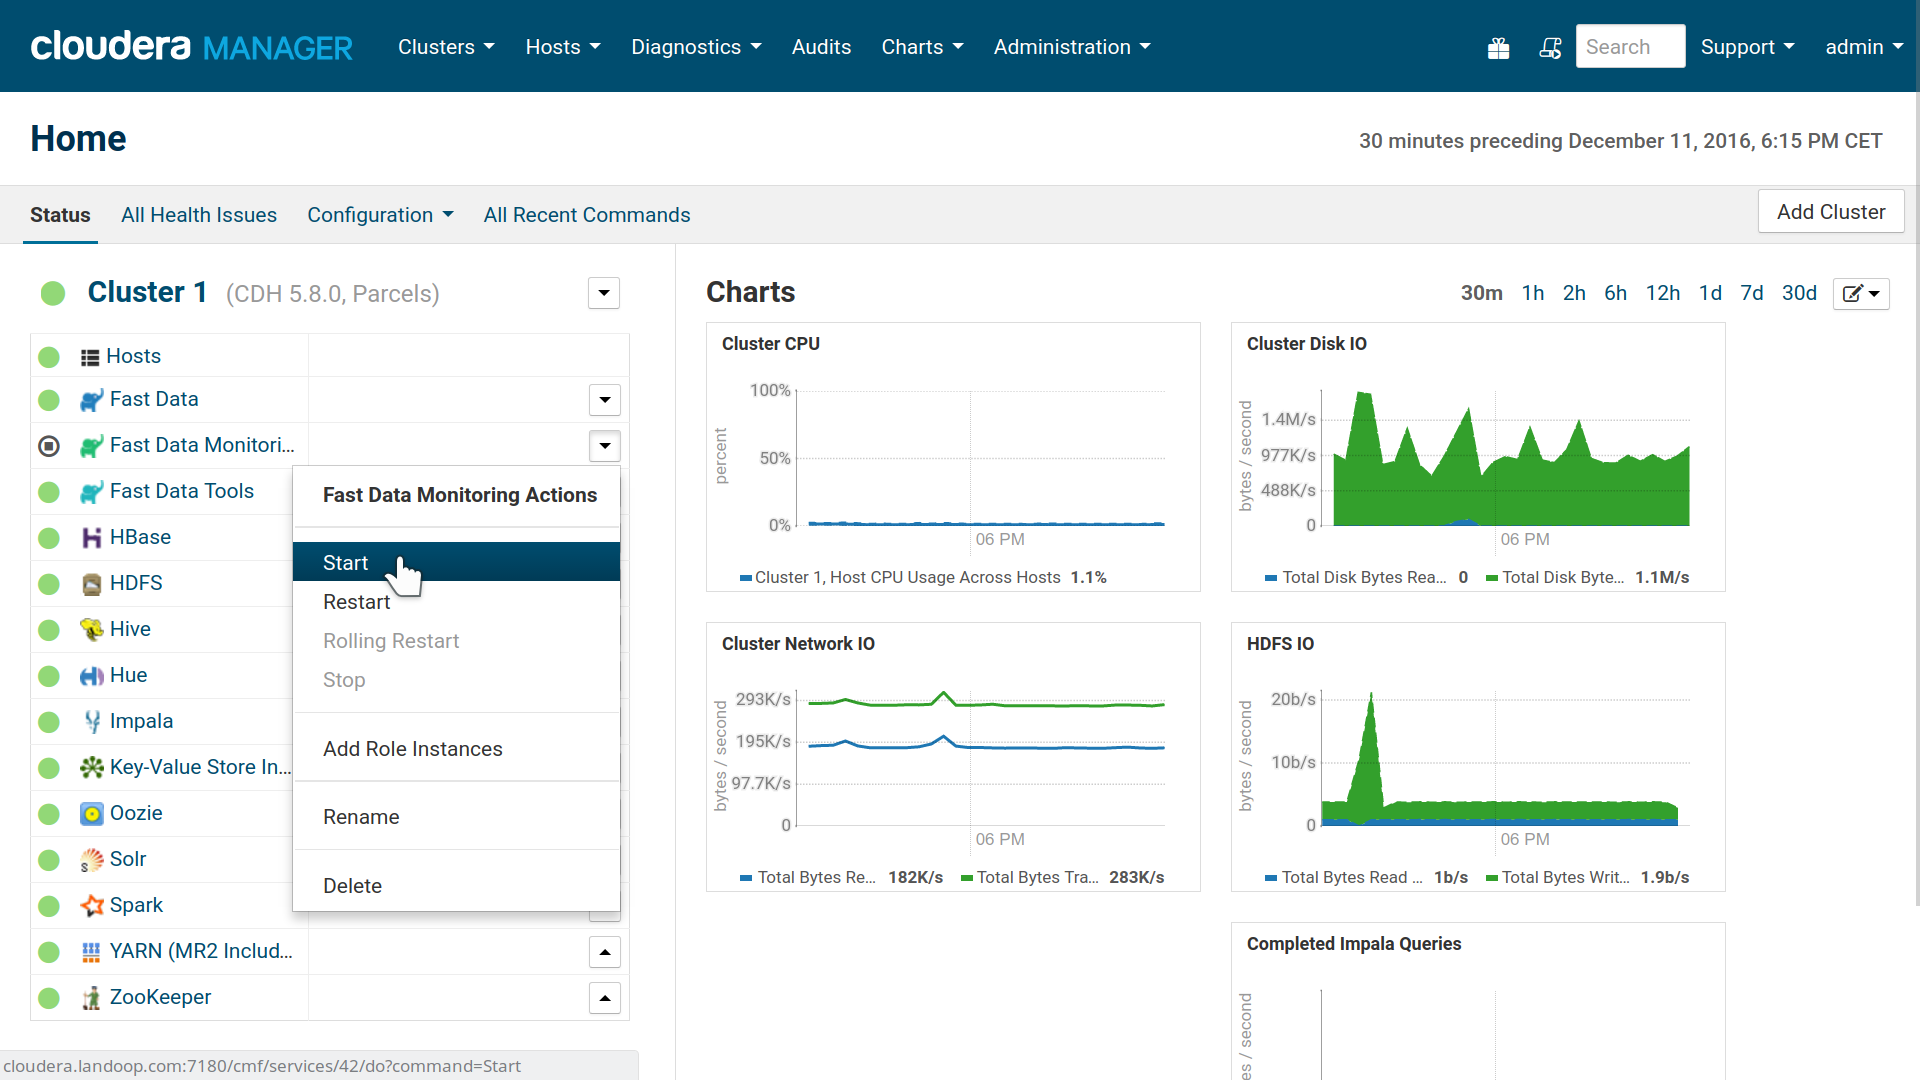
Starting Manually Fast Data Monitoring Service
Note
Our default ports are 3040 for Grafna and 3041 for Prometheus. Only Grafana needs to be able to access Prometheus so you should adjust your firewall accordingly. Of course if you trust your users you may permit access to Prometheus’ Web Interface.
If you would like email alerts, you have to set a SMTP server for Grafana in the service configuration page.
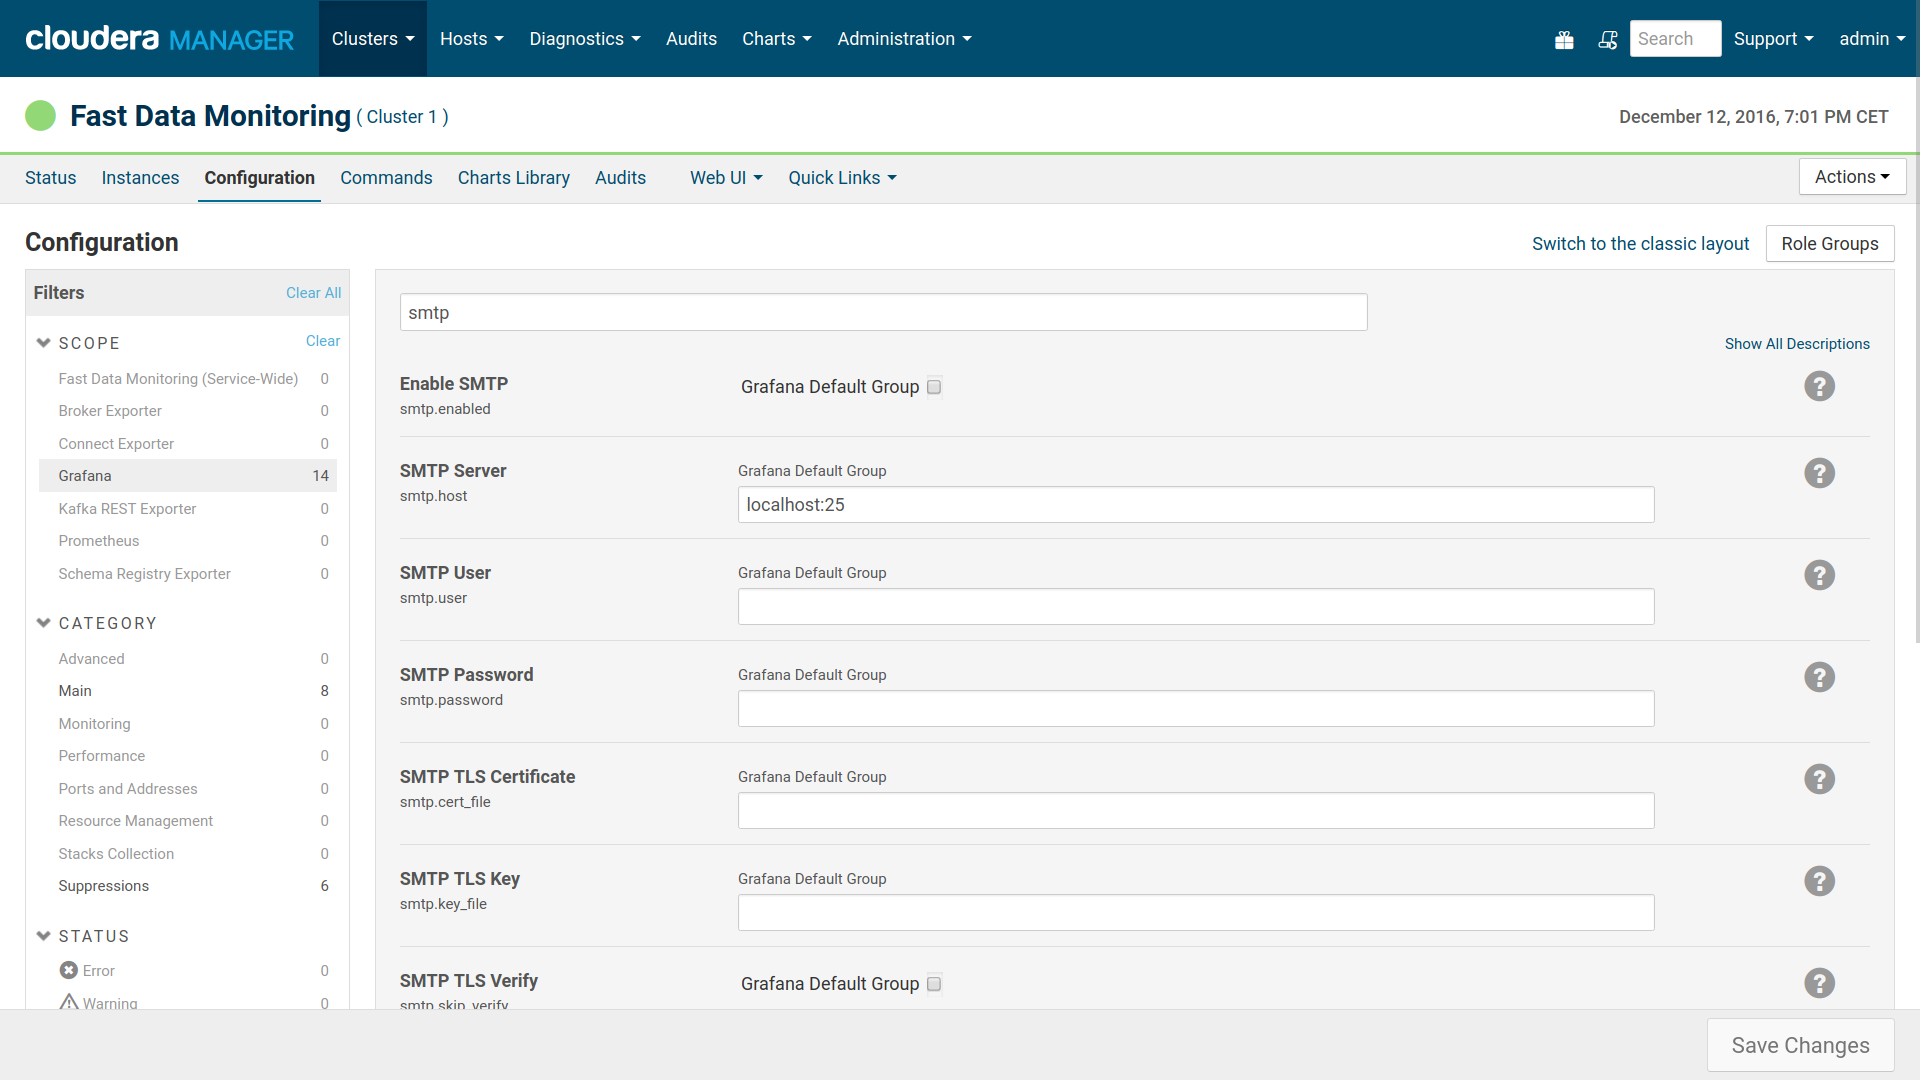
SMTP Configuration for Email Alerts by Grafana
3.1.3. Access the Services
Once your roles are started you are ready to view metrics of your cluster and setup alerts. Visit the Fast Data Monitoring service and you will find links for Prometheus and Grafana.
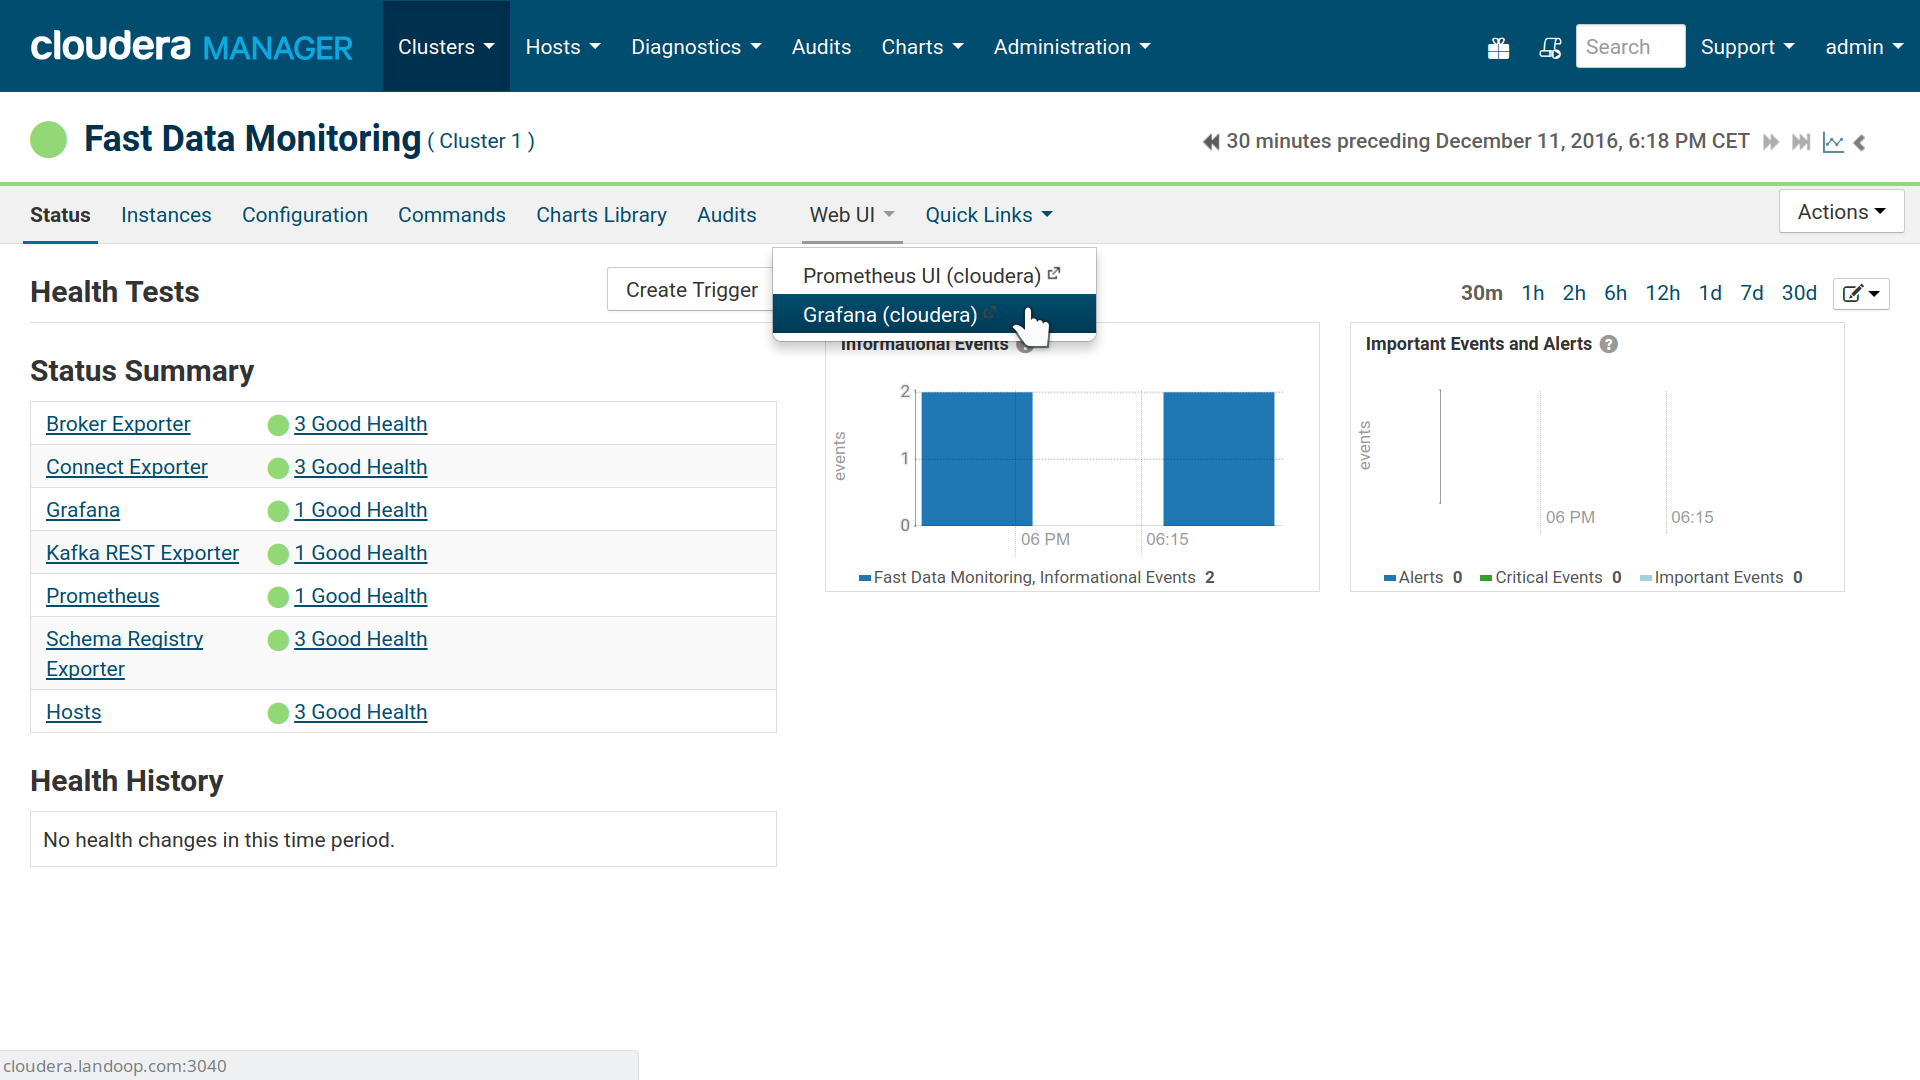
Quick Access to Grafana
The default user for Grafana is admin with password admin. Once logged in
you may change your password and create new users.
We took special care to automatically setup Grafana’s data source to your Prometheus instance and also include a few metric dashboards to help you get started.
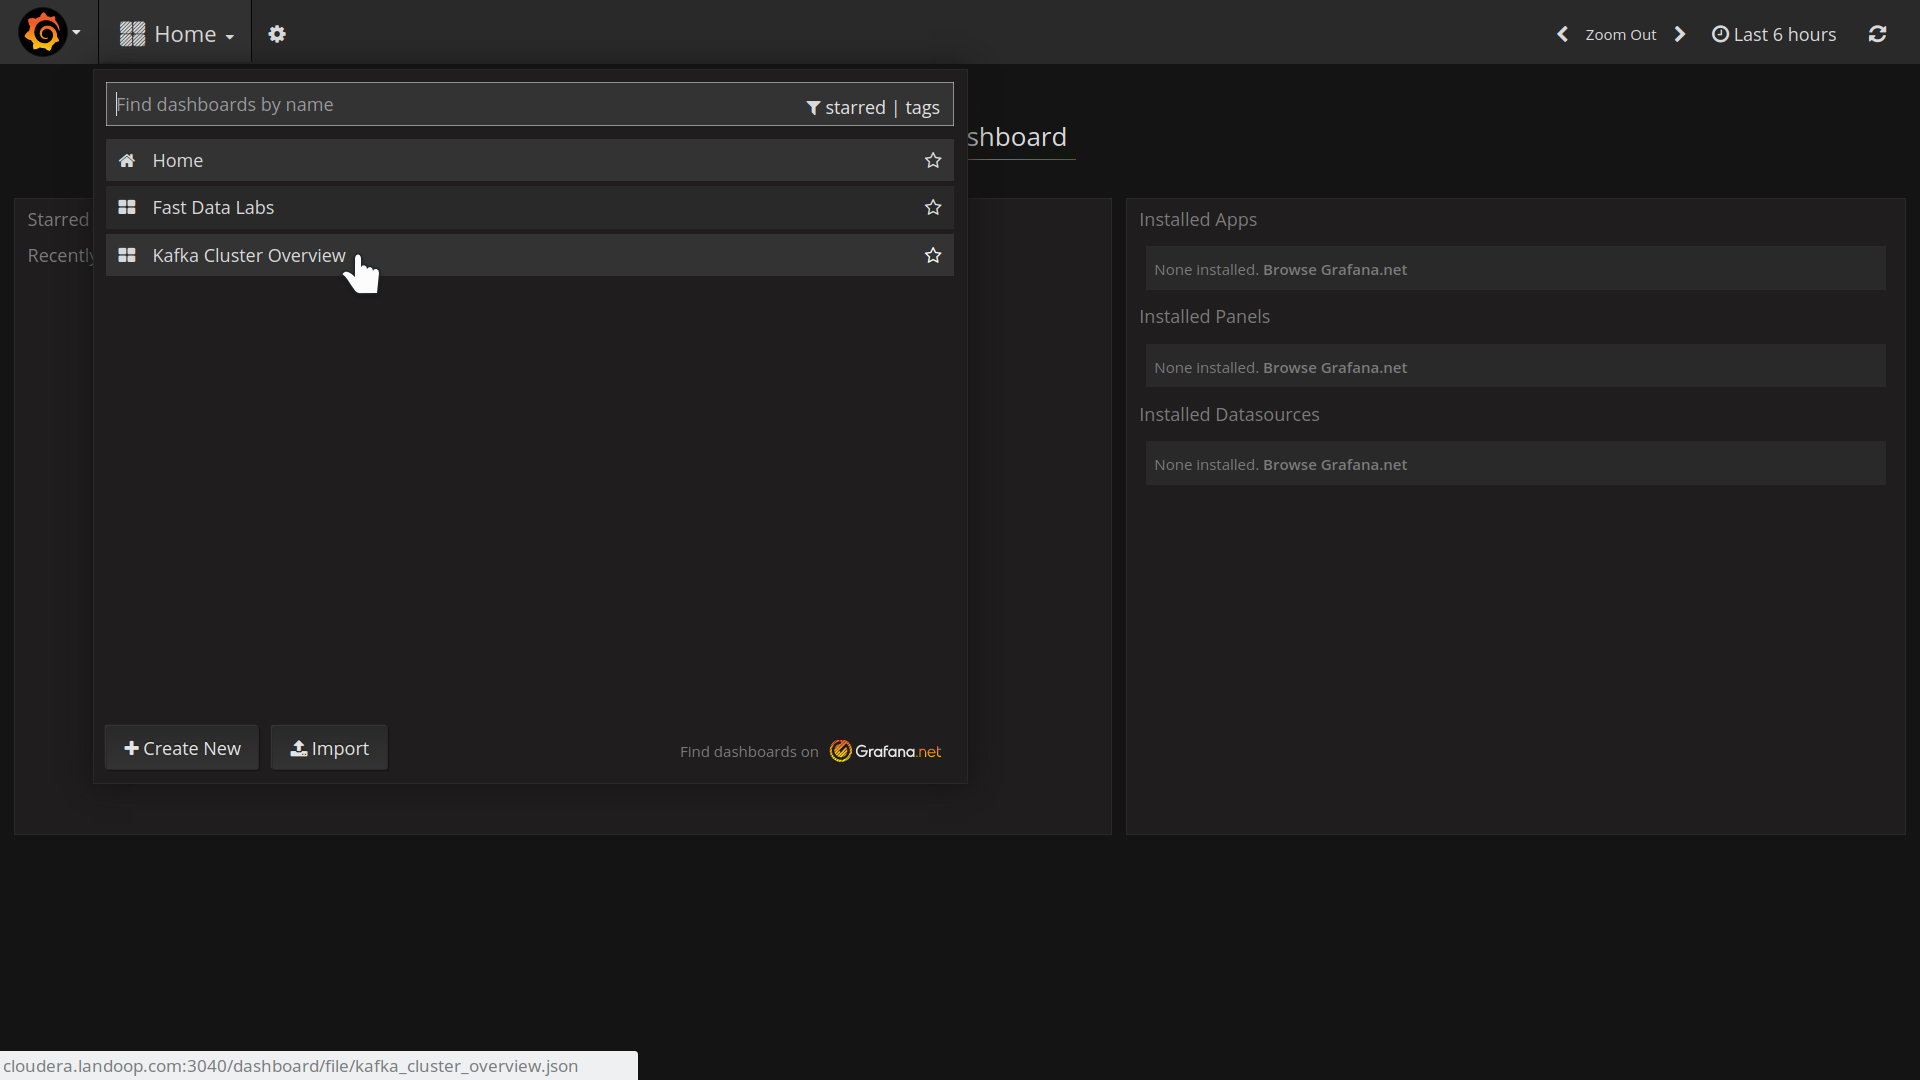
Grafana Interface, Home Page
Our Kafka Cluster Overview dashboard is a good point to start, providing an overview of your brokers.
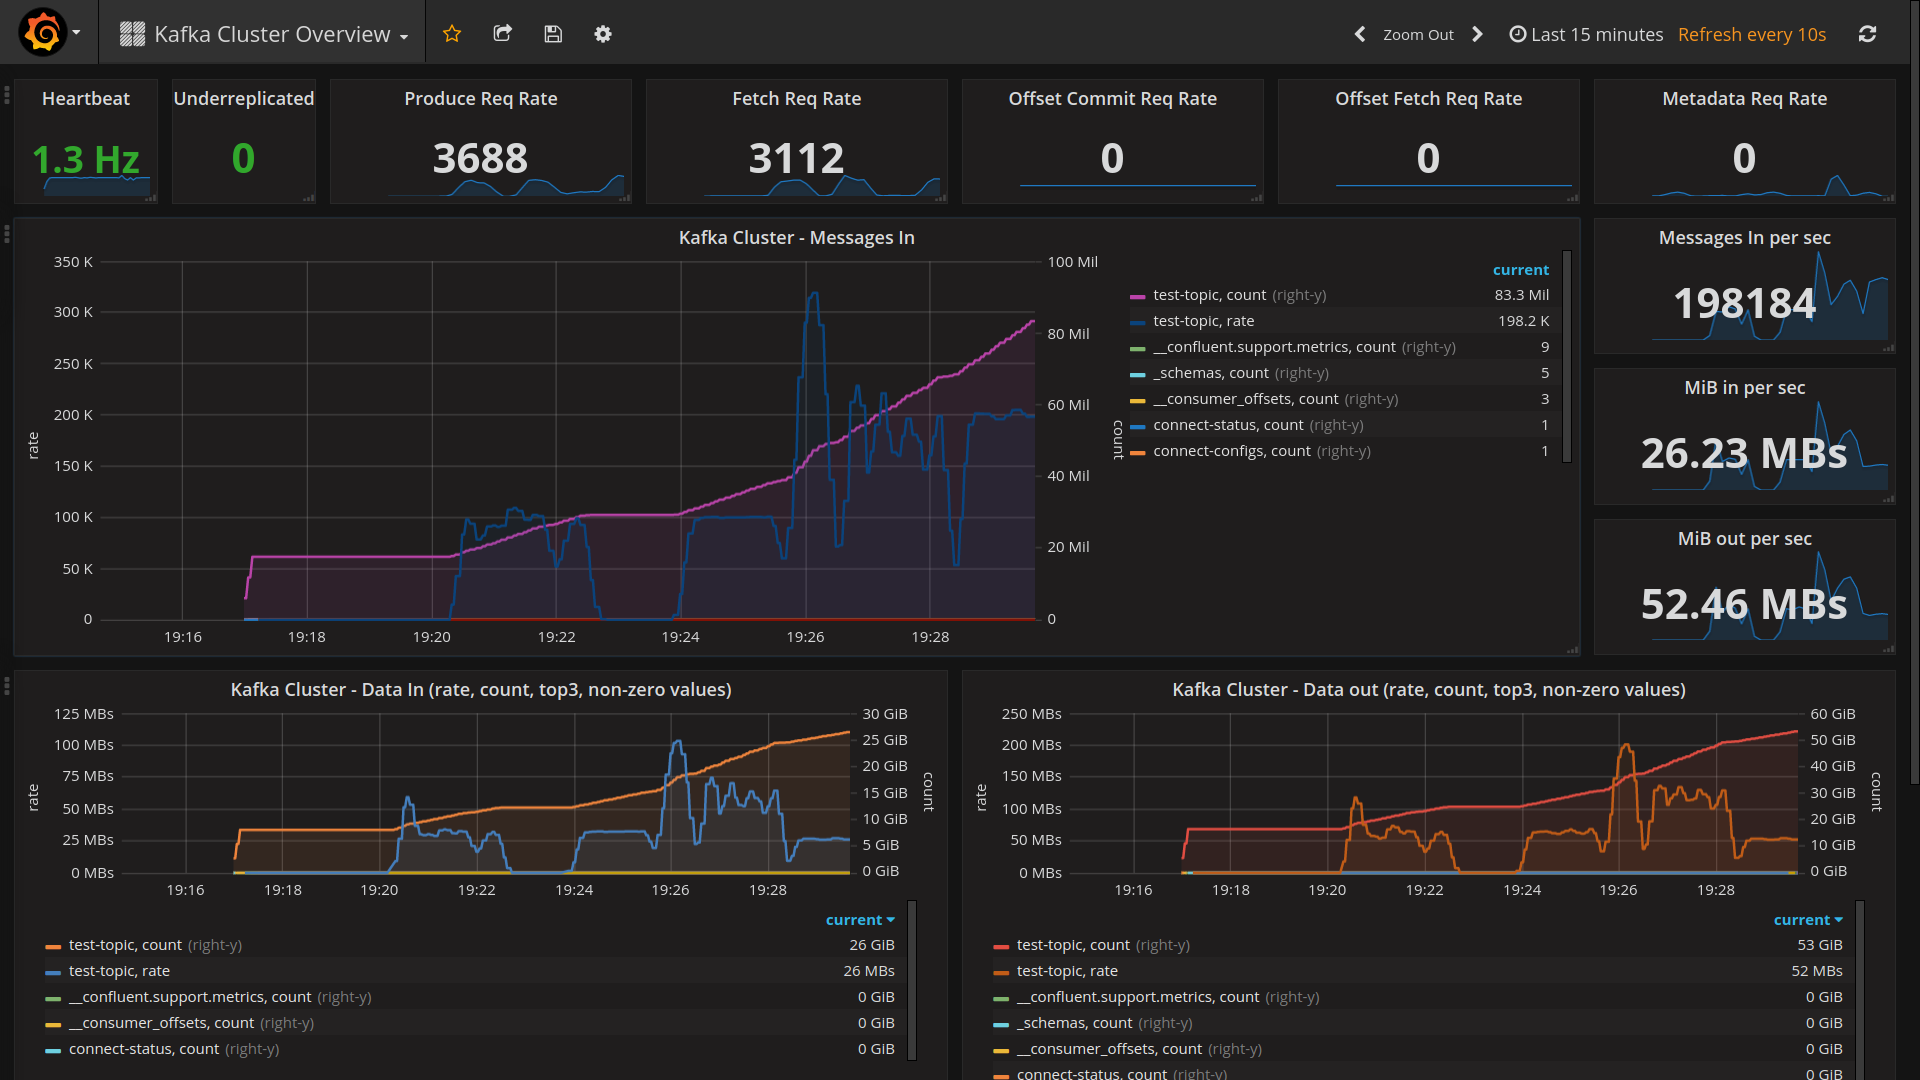
Grafana, Kafka Cluster Overview dashboard
The Prometheus UI isn’t so interesting, but will help to detect problems with your exporters or metrics.
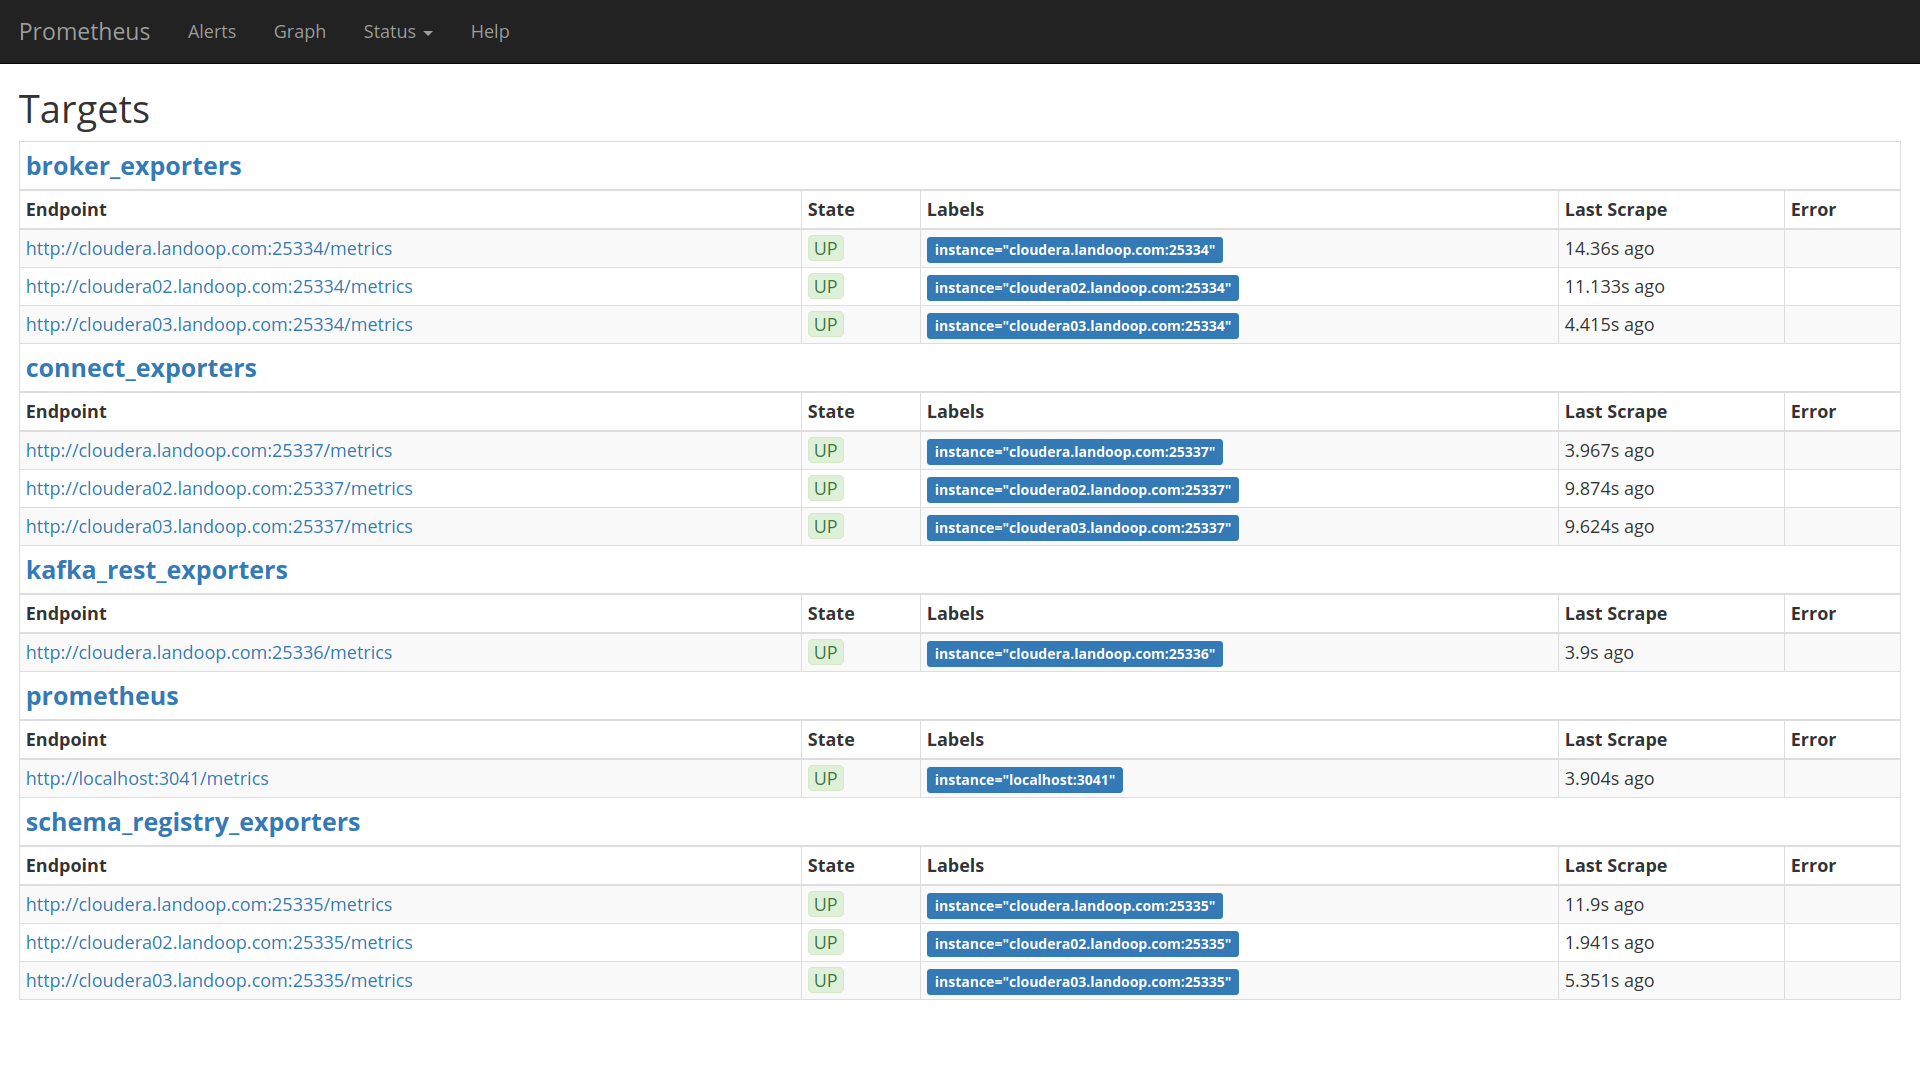
Prometheus Web UI, Targets’ List
We include four dashboards to help you get going; a dashboard that provides an overview of your cluster, a dashboard that provides metrics from producers and consumer groups and two almost identical dashboards that provide application metrics, should you choose to monitor your Kafka apps through our CSD.
Our dashboards have the tag default and are immutable, this means you cannot make any changes to them, nor star them. Also they get updated with every new version of the Fast Data Monitoring parcel.
They are meant to be used as templates you can copy and work on to create your own metrics and alerts. Please remember that alerts can not be added to dashboards that use templates, such as the producers and consumer groups dashboard and the templated version of the application monitoring dashboard.
3.1.4. Cleanup, Reinstall, Remove
Whether you want to remove completely Fast Data Monitoring or re-install the service, the process is simple.
Please remember to backup your Grafana Dashboards if you need them.
3.1.4.1. Uninstall
To uninstall the CSD, you should first stop any running Fast Data Monitoring services and then you delete them from your cluster.
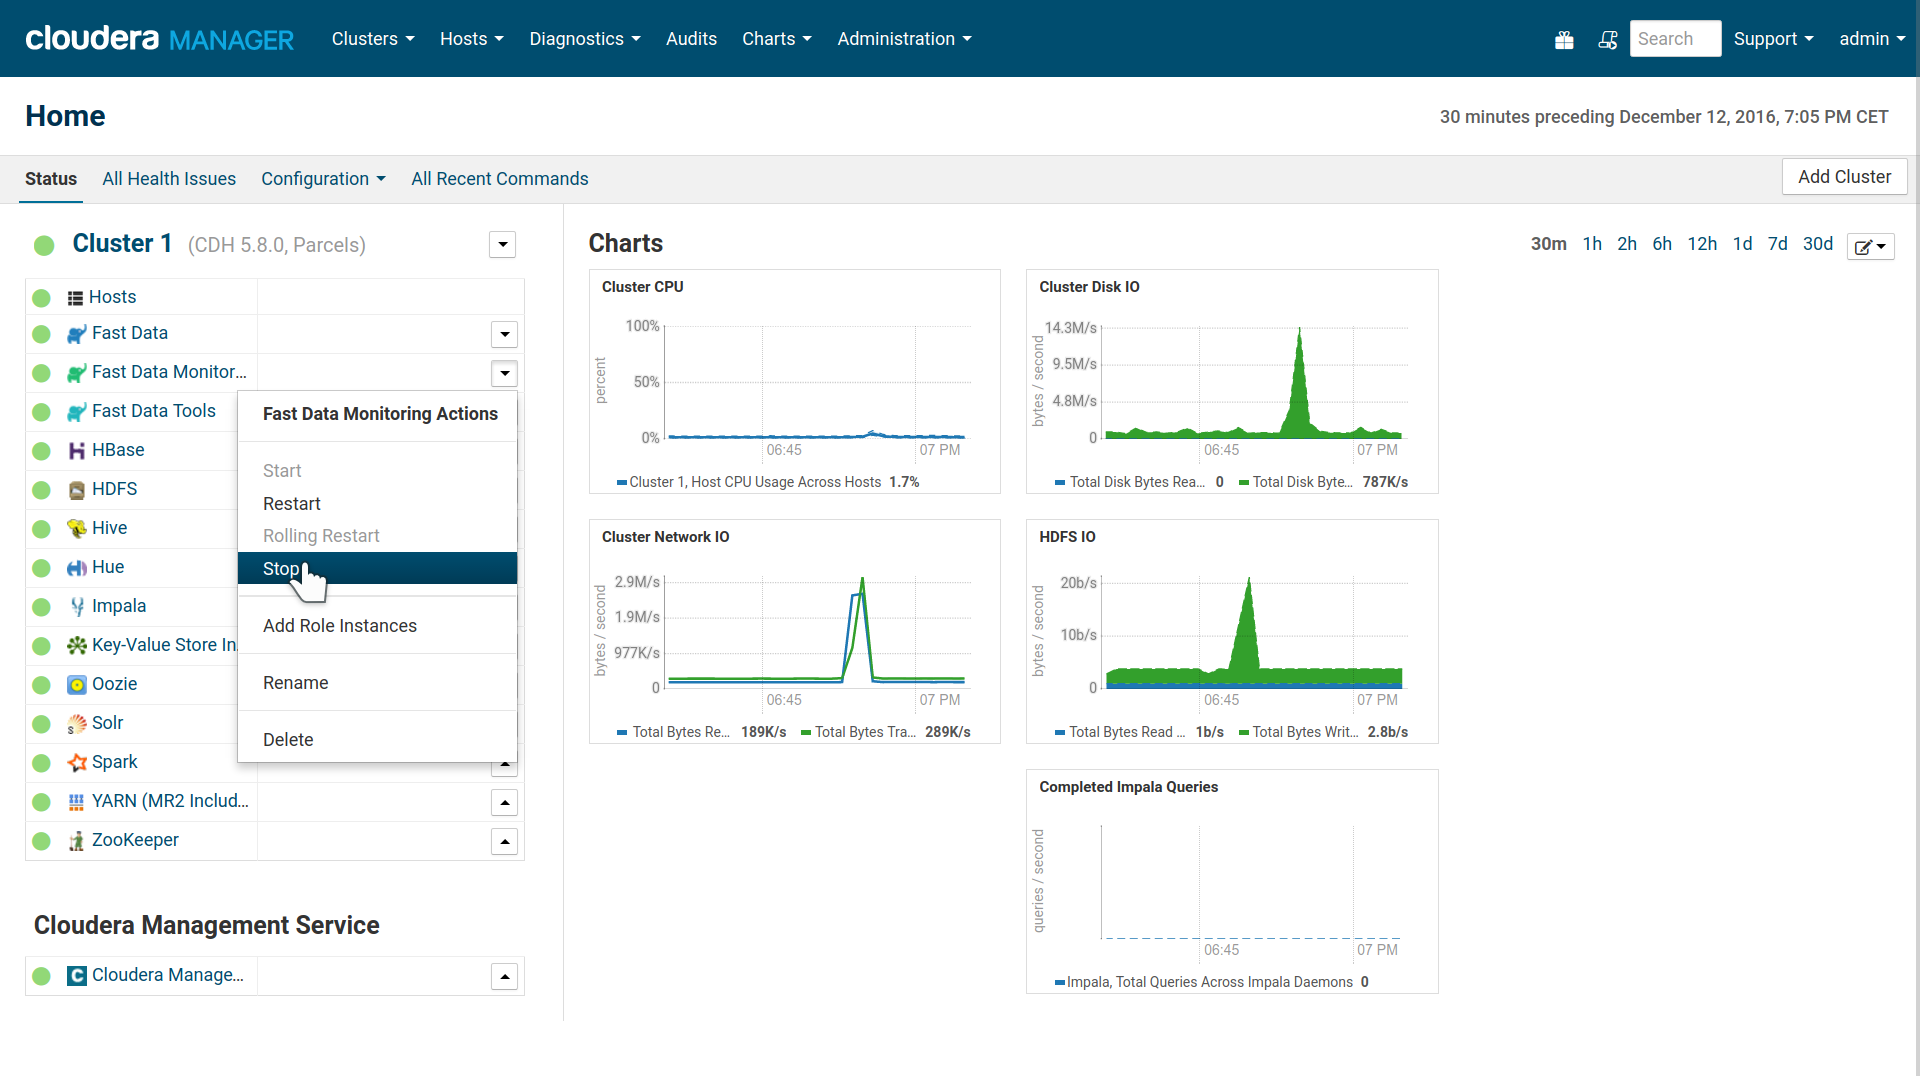
Stop Fast Data Monitoring Service
Next visit the CM’s Parcels tab and deactivate, remove from hosts and uninstall our parcel.
Last stop the Cloudera Manager server and delete the CSD file from your Cloudera
CSD directory (usually /opt/cloudera/csd/) and restart the Cloudera Manager
for the change to take effect.
In our experiments, in one occassion Cloudera Manager wasn’t able to start again after the CSD removal due to missing metric sources. The solution was to copy the CSD back, start CM with it, stop it and remove the CSD again.
3.1.4.2. Clean Data Directories
Fast Data Monitoring stores data under /var/local/fastdatamonitoring and
logs under /var/log/fastdatamonitoring. After removing the CSD or the
corresponding service you may freely remove these directories.